Contents
Introduction
Introductory narrative or video
Objectives
Upon completion of this lesson students should be able to:
- Differentiate between different type metallurgical accounting methods and benefit of metallurgical accounting.
- Recall the definitions of grade, recovery, yield and other characteristics used in mass balancing.
- Recognize the application of two product formula for balancing.
- Provide a brief idea about multi component balancing for complex ores.
Reading
Mass and Volume Balancing
Mass In = Mass Out
Volume In = Volume Out
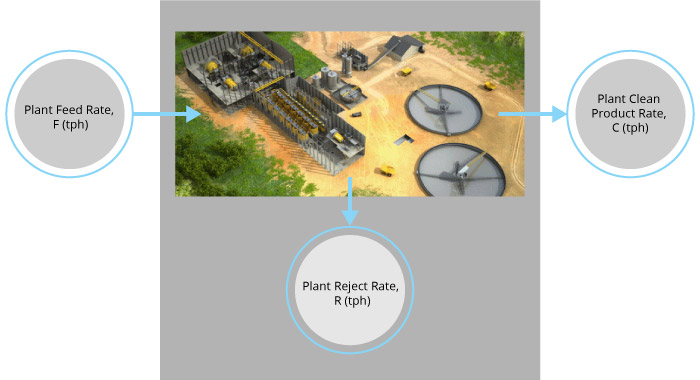
Mass and Component Balance
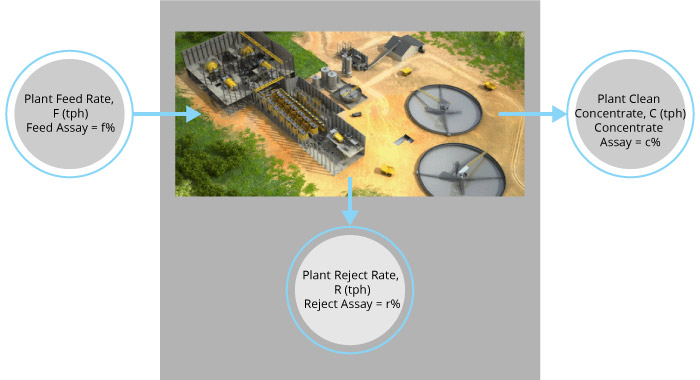
Ff = Cc + Rr
Mass Yield or Mass Recovery
Two-Product Formula
Given the mass and component balance equations :
F = C + R
Ff = Cc + Rr
Mass yield (Y) can be solved as a function of the stream, assays which yields the two-product formula:
R = F- C
Ff = Cc + r (F – C)
Mass Yield Formula Example
Mass Yield = 1.5%
Component Recovery
In many mineral processing applications, the focus is to maintain maximum recovery of the valued mineral or element while also maximizing upgrade or concentrate assay.
Component Recovery Example
Cu Recovery, R = 73.5%
Concentration Ratio, CR
Complex Sulfide Ore Metallurgical Balance
Brunswick No.1 Concentrator
| Process Stream | Weight (%) | Assays | |||
|---|---|---|---|---|---|
| Pb% | Zn% | Cu% | Ag% | ||
| Mill Feed | 100.00 | 3.21 | 7.93 | 0.33 | 2.26 |
| Copper Concentrate | 0.74 | 4.69 | 4.65 | 22.64 | 50.39 |
| Lead Concentrate | 4.80 | 42.20 | 9.62 | 0.33 | 15.48 |
| Zinc Concentrate | 10.52 | 1.12 | 57.76 | 0.18 | 1.75 |
| Tailings | 83.94 | 1.22 | 1.61 | 0.15 | 1.14 |
| Metal Recovery (%) | 63.1 | 76.6 | 50.9 | ||
| Section | Process Stream | Mass Flow (tph) | Copper Assay (%) | Cu Recovery (%) |
|---|---|---|---|---|
| Complete Plant | Mill Feed | 709 | 0.53 | 100 |
| Mill Concentrate | 10 | 33.00 | 88.3 | |
| Mill Tailings | 699 | 0.06 | 11.7 | |
| Rougher | Feed | 716 | 0.55 | |
| Concentrate | 28 | 12.00 | 83.6 | |
| Tailings | 688 | 0.09 | ||
| Scavenger | Feed | 253 | 0.13 | |
| Concentrate | 6 | 2.00 | 2.4 | |
| Tailings | 247 | 0.09 | ||
| Cleaner | Feed | 29 | 12.00 | |
| Concentrate | 15 | 22.00 | ||
| Tailings | 14 | 1.30 | ||
| Re-Cleaner | Feed | 18 | 20.00 | |
| Concentrate | 11 | 31.00 | ||
| Tailings | 7 | 3.00 | ||
| Final Cleaner | Feed | 11 | 31.00 | |
| Concentrate | 10 | 33.00 | 88.3 | |
| Tailings | 1 | 5.00 |
Mass/Volume Flow Determination
- The relationship between the mass (M) and the volume flow (Q rates in a given stream is defined as:
= the pulp density (solids and water) in lbs/ft3
X = solids concentration in % by weight - Volumetric flow rate can be measured by flow meters, P-Q curve relationships for pumps or directly measured.
- Pulp density can be measured using a Marcy Density of nuclear density gauge.
- The solids concentration can be estimated using a common expression or directly measured.
Pulp Density
- Density (ρ) is the ratio of the mass weight (M) of a substance and the total volume (V):
- Water has a density of:
- 1.0gm/ml or 1.0gm/cm3
- 1000kg/m3 – 1tonne/m3
- 62.4lbs/ft3
- Specific gravity is the ratio of the material density over the density of water:
Marcy Scale
- The Marcy scale is a common tool used in preparation plants to measure pulp density.
- The scale uses a container that allows a volume of exactly 1000 ml.
- After collecting the sample, the container is hung on a weight scale which measures in grams.
- The printed scale reads the pulp density directly in grams/ 1ml.
- Since water density is 1.0 gm/ml, the scale also indicates the specific gravity of the pulp.

Mass Flow Determination Example
A classifying cyclone is being fed slurry at a volumetric flow rate of 1000 gpm. The specific gravity of the slurry is 1.1 and the solids concentration was determined to be 15.0 °/o by weight. Determine the mass feed flow rate in tons per hour:
Solution:
Volumetric Balancing Using Pulp Density
- Pulp density measurements around unit operations such as dense medium separators and classifying, cyclones can be used to assess volume yield.
- Consider the balance around a classifying cyclone:
- Thus, the volumetric yield to the underflow stream can be obtained from the following expression:
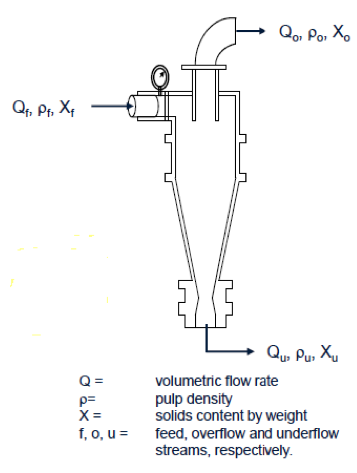
[diagram 135-2-1]
Slurry Solids Concentration by Weight
A classifying cyclone is treating 150 gallons/min of slurry. A plant technician has measured the pulp densities of the process streams using a Marcy density gauge and reported the following: Ïf = 1.08 gm/ml, Ïo = 1.03 gm/ml and Ïu = 1.20 gm/ml. Determine the volumetric flow rates to each stream.
Solution:
_________%
_________ = _________ gallons/min
_________ = 150 X (1 – _________) = __________ gallons/min
- The solids concentration X of a slurry by weight can be measured directly by:
- Collecting a sample,
- Measuring the weight of the total slurry or pulp Mp
- Drying the sample and
- Measuring the dry weight of solids Ms
Mw = water weight
- This equation is often used to determine the amount of water in a process stream1 knowing the solids concentration by weight and the tons/hr of solids in a process stream.
Solids Concentration Example
The underflow stream from the classifying cyclone bank contains 100 tons/hour of ore which represents 45% of the total slurry mass.
The downstream concentrators require a feed solids concentration of 30% by weight. How much water is required to be added to dilute the stream to the required solids concentration?
Solution:
________ tph
________ tph
________ tph
= _______ gpm
% Solids & Pulp Density Relationship
- It often occurs that the knowledge of the solids content is needed within a time frame less than the sample preparation and analysis time.
- When this situation arises, the solids content by weight can be estimated knowing the pulp density (Ïp =) as measured with the Marcy scale and using the following equation:
X% =Ïs = solids density or specific gravity
≈ 2.65 for most host rock minerals.Ïw = water density (62.4 lbs/ft3 or 1gm/ml) or specific gravity (=1).
Estimation of Solid Density
- The density of solid can be estimated if you know the composition by weight or volume of each component in the solid and the respective solid densities.
- For example, assume that raw ore is a two component system comprised of a valued mineral and host rock having relative densities of 6.30 and 2.65, respectively. The amount of valued mineral is 30% of the total ore.Total Solid Mass, M: Mineral + Host Rock – 30 + 70 = 100
Total Volume, Vs:
Total Solid Relative Density
Circuit Balancing
- The data generated from process units and circuits are used to make important decisions.
- Plant design considerations
- Operational efficiencies
- Potential upgrades
- As such, reliable data is very important for an operating plant.
- All data must be checked for proper balancing based on the ‘laws of conservation’.
- ‘What goes in’ = ‘What goes out’
Material Balancing
Balance Summary
Overall: F = C+R
Pb: Ff1 = Cc1 + Rr1
Zn: Ff2 = Cc2 + Rr2
L/S Ratio: Ff3 = Cc3 + Rr3
Questions:
- Is this a good set of data?
- Which values are not reliable?
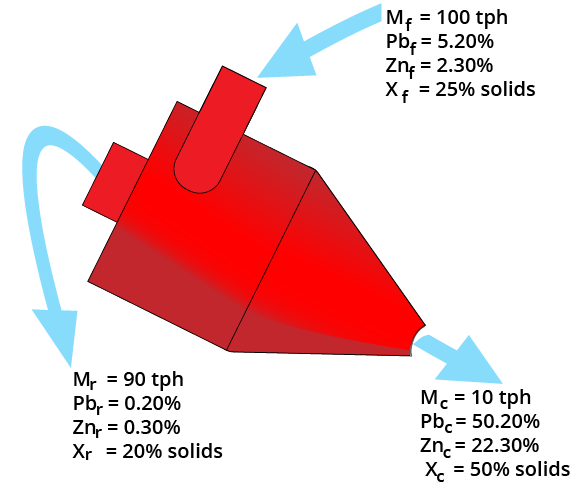
Material Balance
Overall Balance
F = C+R
100 = 90 + 10
100 = 100

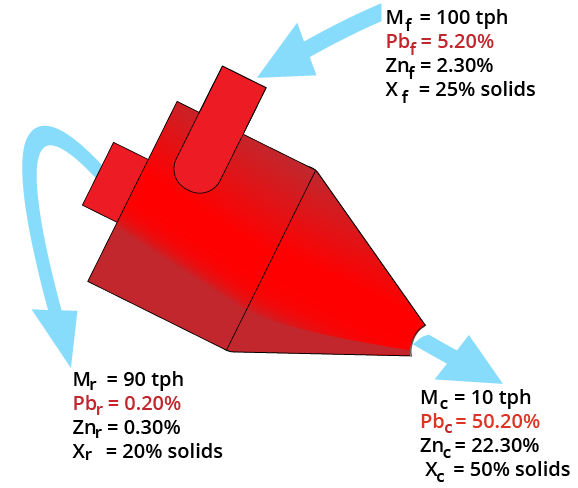
Lead Balance
Ff = Cc+ Rr
100(5.20) = 90(0.20) + 10 (50.20)
520.00=18.00 + 502.00
520.00= 520.00

Zinc Balance
Ff = Cc+ Rr
100(2.30) = 90(0.30) + 10 (22.30)
230.00= 27.00+223.00
230.00 ≠250.00


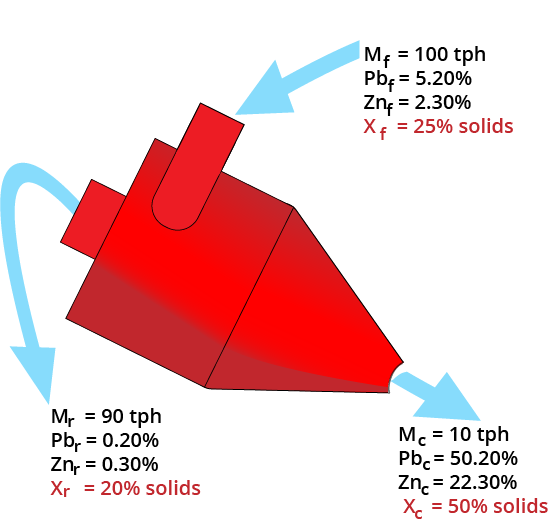
Slurry Balance
Mass balance equations must be satisfied!
- Must use 1/Solids%
| Product Stream | Mass (tph) | Solids (%) | Inverse Solids | Slurry (tph) |
|---|---|---|---|---|
| Clean | 10 | 50 | 1/0.5 | 20 |
| Reject | 90 | 20 | 1/0.2 | 450 |
| Feed | 100 | 25 | 1/0.25 | 400 |
Water Balance
L/S Ratio Balance
Ff = Cc+ Rr
100(3.0) = 90(4.0) + 10(1.0)
300= 360+10
300 ≠370
Example: 3.0 = 3 parts Water to 1 part Solids = 25%

Two-Product Formula
Balances:
F = C + R
Ff = Cc + Rr
Multiply by r:
Ff = Cc + Rr
-(Ff = Cc + Rr)
______________
Ff- Ff = Cr – Cc
Rearrange:
F (r-f) = C (c-r)
or
Yield = C/F = (r-f) / (r-c)
* Only assays needed to get product-to- feed ratio
Two-Product Formula (Pb assays)
Overall:
C/F = 10/100
= 10%
Pb:
C/F=(5.20-0.20)/(50.20-0.20)
= 10%
Two-Product Formula Characteristics
- Formula only applies under steady-state conditions
- Formula very sensitive to variations in the reject assay, “r”
- Formula inaccurate when component is not separated
- Formula may calculate different yields for each assay (due to experimental errors)
Two-Product Formula (various assays)
Pb:
C/F = (5.2-0.2)/ (50.2-0.2)
= 10%
Zn:
C/F=(2.3-0.3)/(22.3-0.3)
= 9%
1/Solids:
C/F = (1/25-1/20) / ( 1/50-1/20)
= 33%

What to Do with Unbalanced Data
Eliminate Data
- avoid collecting or ignore data that conflicts
- most common approach in industry
- arbitrary and highly subject to user biases
- not getting full value out of your data
Adjust Data
- create consistent balances by adjusting data
- use method of “weighted least squares”
- adjustments should (i) satisfy all mass balances equations and (ii) be as small as possible