Contents
Introduction
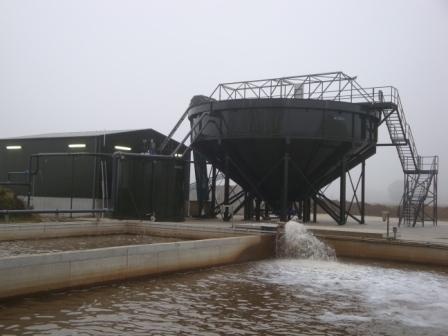
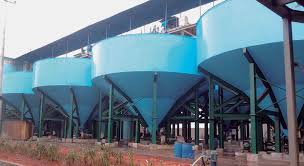
Dewatering involves a separation between solids and water for one of the following purposes:
- To prepare feed to a downstream process that requires higher solids concentration;
- To reduce the volume of slurry being fed to downstream processes;
- To achieve a product having a moisture content that is equal to or less than a given target value.
Clarification is the process of treating waste slurry to provide water of sufficient quality to be recycled for use in the preparation plant.
[image 145-6-0a]
[image 145-6-0b]
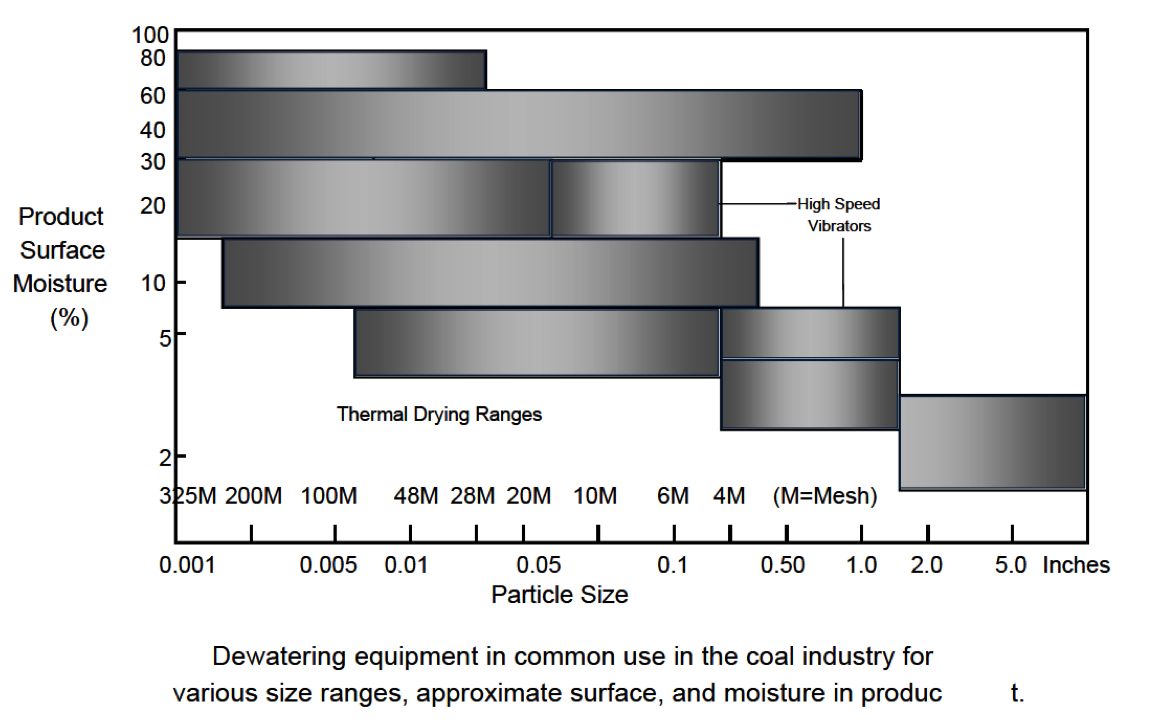
Dewatering Equipment
[image 145-6-1]
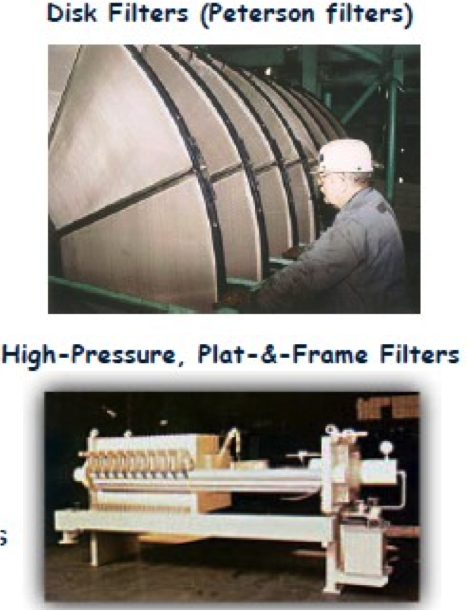
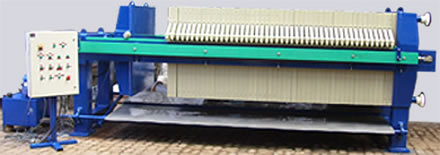
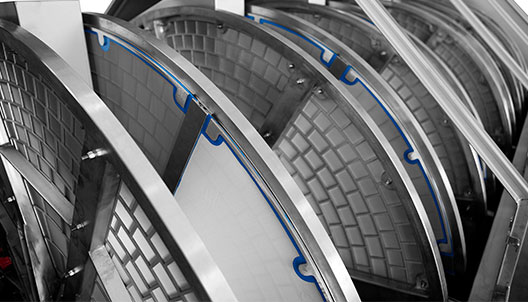
Filtration
Filters are used when it is desired to maximize the recovery of particles having a size less than 325 mesh.
Typical vacuum disk filters are relatively low cost and achieve high particle recovery. However, product moisture values are generally greater than 25%.
To achieve both high particle recovery values and acceptable product moisture values, high pressure filters are used. Two problems:
- High capital cost, i.e., >$500,000 each;
- Semi-batch operation and thus two units are required for continuous operation.
[145-6-2a]
[145-6-2b]
Filter Product Moisture Factors
- Cake Thickness
- Pressure Drop across cake
- Drying Time
- Volume of Air pulled through cake
- Viscosity of Liquid
- Surface Tension of Liquid
- Filter Media
- Size Distribution of solids
- Permeability of Cake
- Specific gravity of dry solids
- Inherent Moisture of solids
- Surface Properties of solids
- Type of Filter
- Homogeneity of cake formation
- Interfacial tension of solids and liquid
- Temperature of gas and liquids
(cfm/ft2)(P/W)(td)
where cfm of air per filter area in ft2,
W is the weight of the dry filter cake per filter revolution,
P the total pressure drop, and
td the filtration time per cycle.
As such, production moisture decreases with:
- An increase in P and td.
- A decrease in the filter cake weight W
Filter Design
The required area and number of filters needed is a direct function of the required product moisture and the required amount of filtrate needed to be separated from the solid.
The filtrate, Q, can be assumed using the D’Arcy equation:
Q = AΔp/U(Rm+Rc)
ΔP = the pressure drop across the cake or driving pressure,
U – the filtrate viscocity,
A = the filter area,
Rm and Rc = membrane and cake resistance
[image 145-6-3]
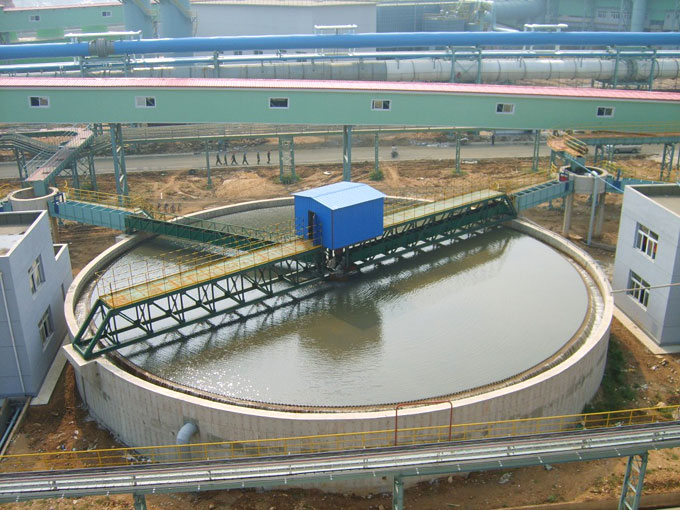
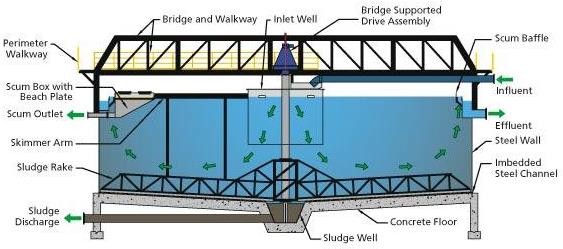
Clarification (Thickeners)
The principle objectives of a thickener are to:
- Clarify water for reuse in the plant;
- Thickening of the solids.
To design a thickener we must know:
- Total feed volumetric and mass flow;
- Identity of unwanted solids in the overflow stream;
- Desired concentration of solids in the underflow stream.
The design parameters to be determined include:
- Cross-sectional area;
- Total depth.
[145-6-4]
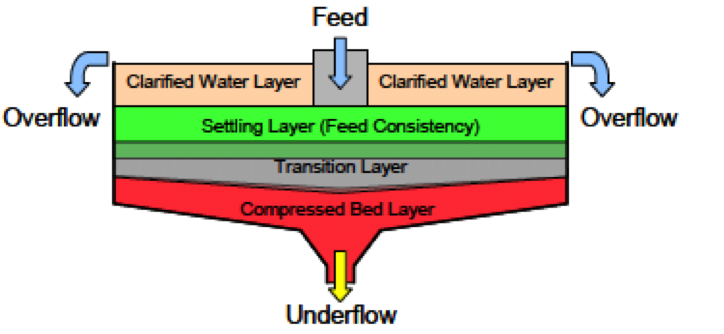
There are three modes of sedimentation in a thickener:
- Clarification in which solids settle either individually or are collected into separate floccules, each of which then settles at its own characteristic settling rate, closely related to Stoke’s law;
- Zone settling in which particles cohere into a structure such that all in a given neighborhood subside at the same rate, but the structure does not lend mechanical support;
- Compression in which the structure is capable of mechanical support.
[image 145-6-5]
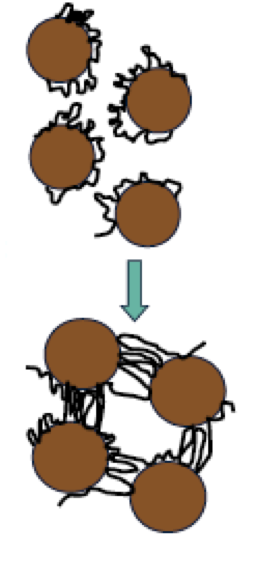
Particle Growth
Particle aggregation is a key component to consider in the design and operation of a thickener.
Particle enlargement affects:
- Clarity of the overflow stream;
- Settling rates (reduces thickener size);
- Underflow solids concentration.
Particle enlargement typically involves the addition of:
- pH modifiers;
- Adjusts surface charge
- Coagulants;
- Neutralizes surface charge.
- Flocculants.
- Aggregates particles
- Cationic = added first to initiate particle aggregation.
- Anionic = high molecular weight added last to bridge particles for finalize aggregation.
[image 145-6-6]
Clarification Zone Design
Clarification zone requirements are commonly expressed in terms of overflow velocity, vo, and, t, retention time.
These parameters relate to pool area and depth according to the following expression:
vo = Q/A t = V/Q = Ah/Q = h/vO
A = settling area of the clarifier in m2,
h = depth of the clarification zone in meters,
V = clarification zone volume in m3,
Q = the volume of the overflow per unit time in m3/h.
Residence time should be sufficient to allow the aggregates to settle through the clarification zone.
Typical settling rates are 4 to 6 inches/minutes and may go up to 8 to 10 inches/minute for undersized thickeners.
Thickener Area Design
Coe and Clevinger provided an expression that relates the settling rates of the particle aggregates and the required area of the thickener when the medium is water:
A = 1.333 (F-D)/V
A = the area in ft2/tph of dry solids per 24 hours (unit area),
F&D = the liquid-to-solid weight ratio in feed and underflow, respectively,
V = aggregate settling velocity in feet/hr.
The relationship between area and depth is most important for the following reasons:
- Tank volume must provide sufficient residence time considering both operational efficiency and mechanical design;
- Thickener efficiency decreases as the ratio between depth and diameter decreases.
As such, a number of batch tests are run with vayinf F values and thus different V.
A plot of unit area A versus F establishes the maximum value of A which must be used for design purposes.