Contents
Objectives
- Review Syllabus and Professional Behavior policy
- Describe Class Requirements and Expectations
- Discuss instrumentation in process industries
- Describe the major process variables
- Define instrumentation terms/concepts
- Identify P&ID symbols for instrumentation signals
Reading
Instrumentation
- What is ‘instrumentation’?
- Where do you use instrumentation in your daily life?
What is Process Instrumentation?
- Why do we need it?
- What does it look like?
- Why do you (Operators) need to know?
4 Major Process Variables
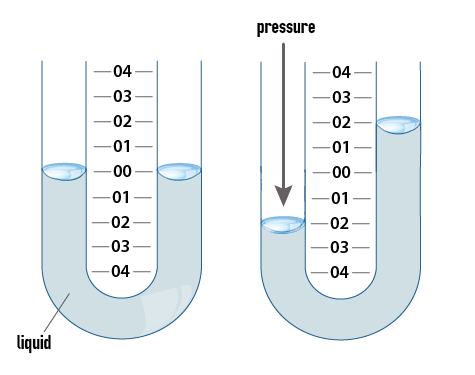
- P – Pressure
- T – Temperature
- F – Flow
- L – Level
Process Variables
[image 140-1-01]
Flow

[image 140-1-02-01]
Terms to Know
- Variables — process conditions that will change (vary) — F, T, P, L, analytical
- Differential, Delta, ∆
Difference between values at two different points - Units — measurement system used to express the variable — psi, deg F, inches, etc
- Unit Conversions — formulas to change from one set of units to another, for the same variable
- Scales, Scaling — used in input/output —
relationship between units of two different and related variables. - Indicate, Transmit, Record, Control – later
- Signal type
Analog, Digital, pneumatic - Local —
located at or near the process
Sensors, local readouts, etc - Remote —
Located away from the process — control room
Controllers, readouts, recorders, etc - Automatic/Manual
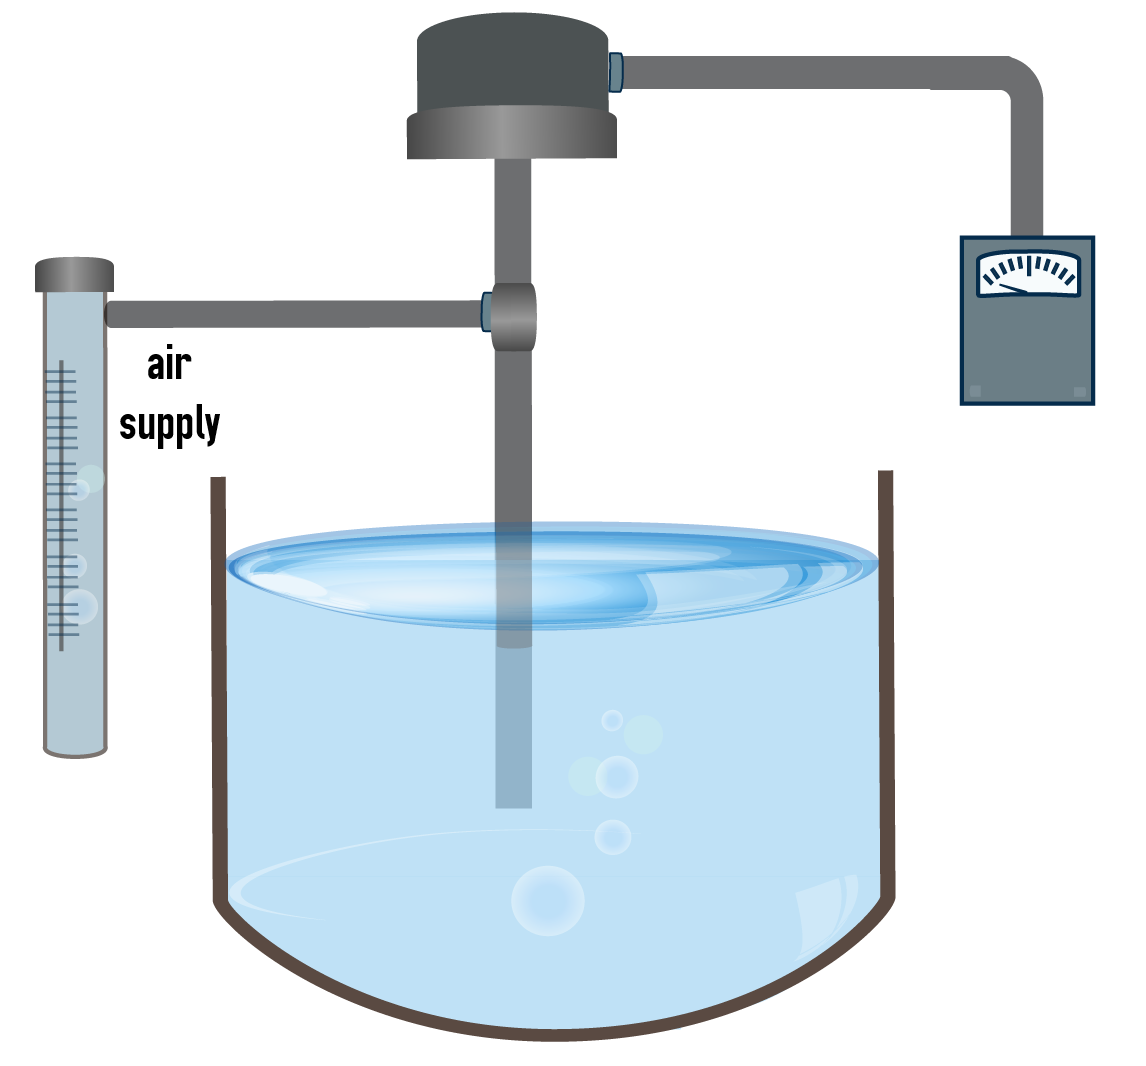
Local Instrument
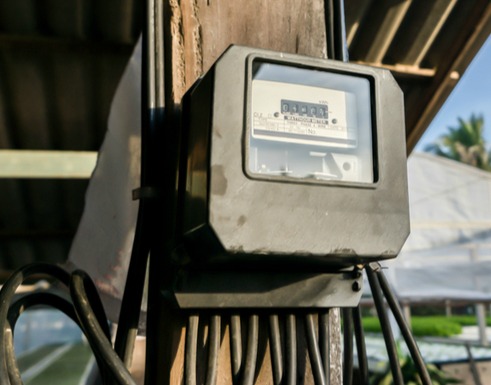
[image 140-1-03]
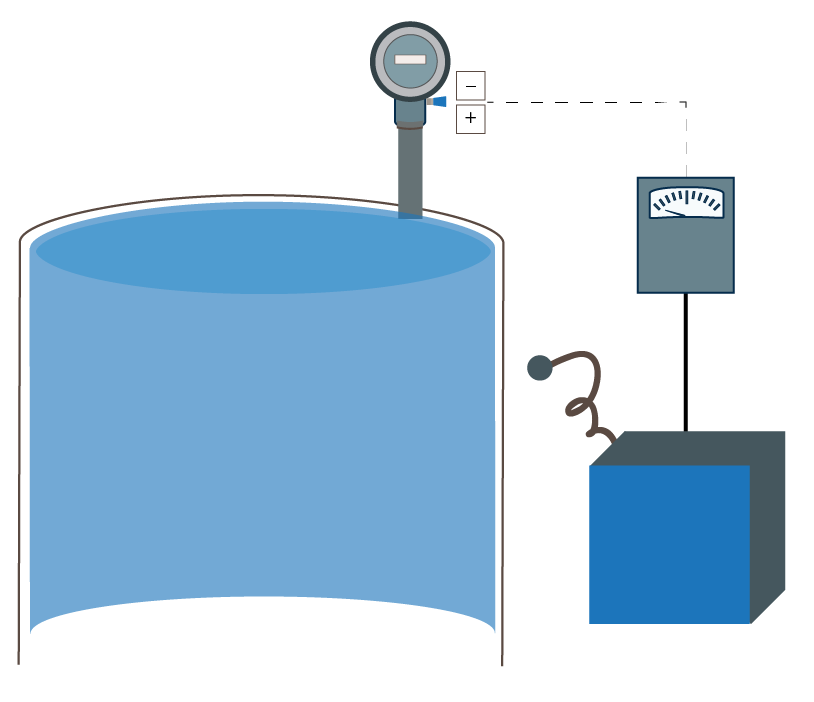
Remote Instrument
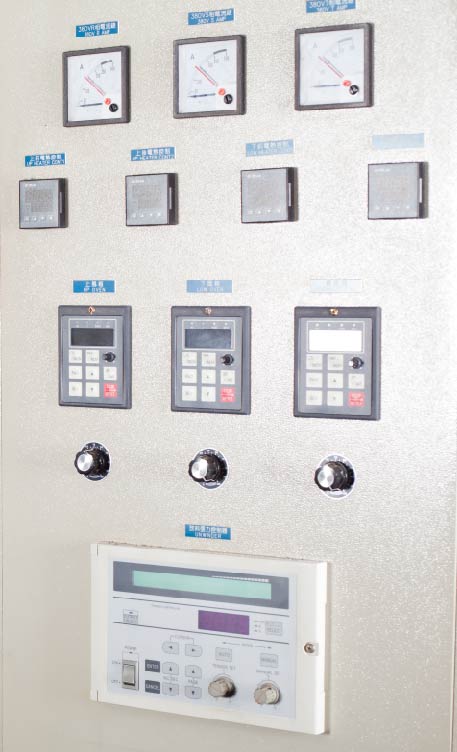
[140-1-04]
Instrument Functions
- Indicating — displays the current reading
- Transmitting — communicates data via signal
different types of signals - Recording — keeps historical data — graphs, run charts, data records, etc.
- Controlling — manipulating process variables to keep a specific variable at a certain value
Control Loops
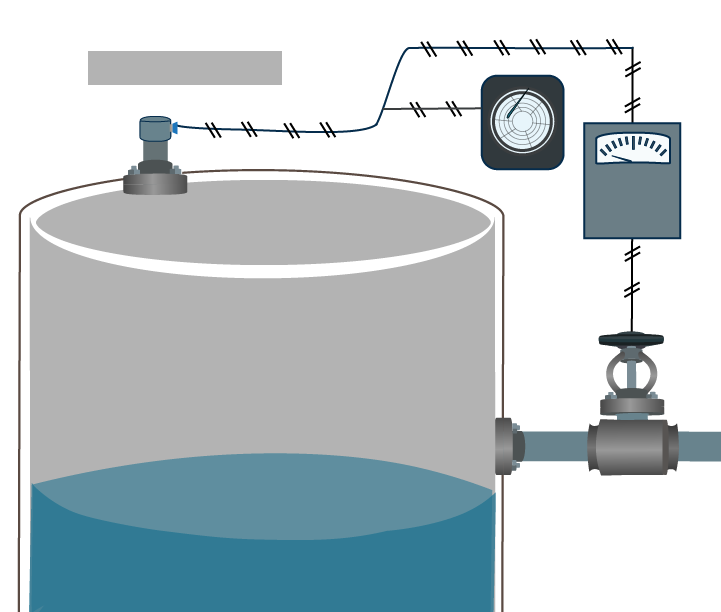
[image 140-1-05]
Pneumatic Instruments
[140-1-06]
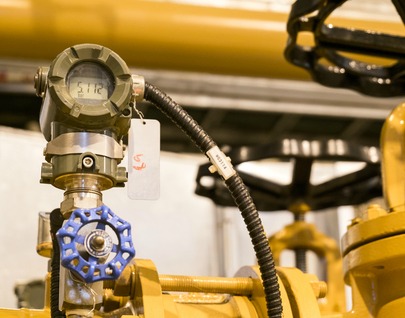
Electronic Instruments
[image 140-1-07]
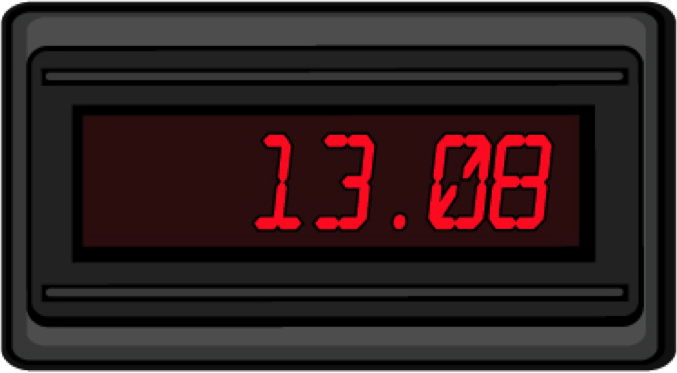
Digital Instruments
[image 140-1-08]
Analog Signals
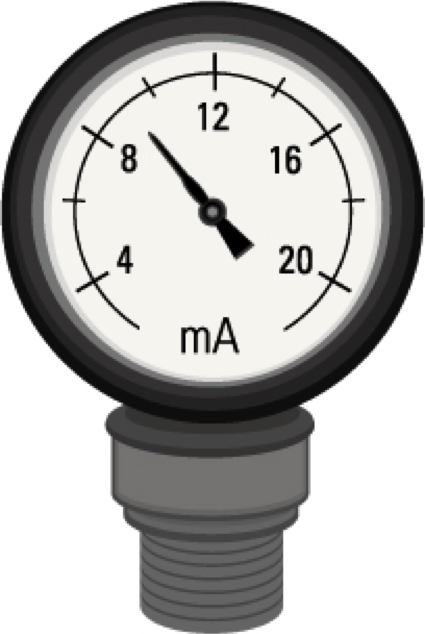
[image 140-1-09]
Digital Signals
[image 140-1-10]
Calculations
MAJOR RULES OF SOLVING ALGEBRAIC EQUATIONS:
Order of operations:
- Work outwards from any terms that are inside parentheses
- Then do any multiplication/division operations
- Then do any addition/subtraction operations
An equation is simply a way to express the fact that the terms on either side of an ‘equals’ sign (=) are equivalent. That means that if you do the same mathematical operation to each side of the equals sign, the two sides are still equivalent. For example, multiply both sides by 2, and the equation is still true.
Any term divided by itself = 1. This is how you manipulate the equation so that you end up with only one unknown term. Then you solve for that term.
Units used with values also multiply and divide. Usually you want to end up with only one set of units in the answer, so you can double-check your work by making sure that all other units cancel each other out. mA/mA = 1 (no units)
Drawing Information
- P&ID — stands for?
- Piping and Instrumentation Diagram
- Outlines function of instrumentation and controls
- References:
- Chapter 12 in Textbook — used throughout the semester
- Alpha Oil Legend Drawing D-00-F1000
P&IDs — Instrumentation Information
- Tag Number Identification — in Balloons
- See table 12-1
- Physical type of instrument, how installed
- Varied levels of detail available on a P&ID
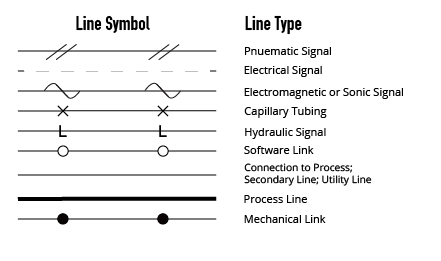
- Type of signal sent/received from instruments
- See Table 12-4
- Control scheme — how instruments interact with each other and with the process
- More advanced — later in the semester
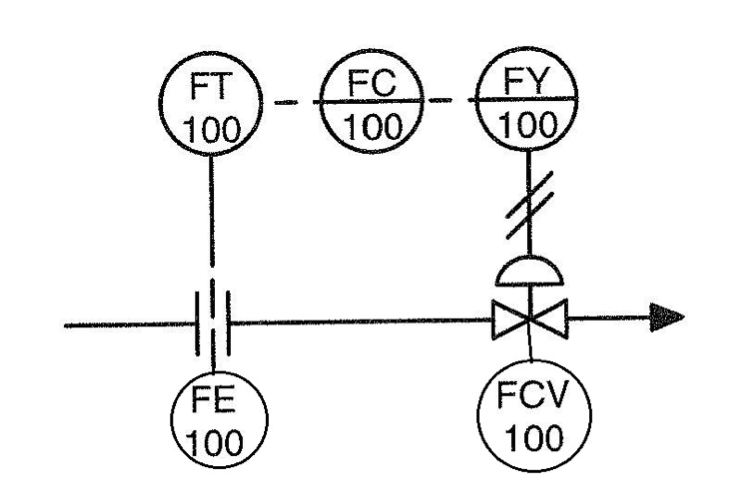
Example
- Tag Numbers: FT-100
- Type of Instrument:
- FE-100 is the symbol for an orifice plate flow meter
- Type of signal: FY-100 to FCV-100 is a pneumatic signal
- How do they interact? We will learn control theory later in the course.
[image 140-1-11]
Tag Number Functional Description: Table 12-1
- Start in Left-Hand Column, then move to the right through the columns.
- First letter indicates the measured variable; following letters indicate the function.
- Always keep moving to the right — you do not move backwards through the column.
Example:
FIC = Flow Indicating Controller
PDE = Pressure Differential Element
Instrument Terminology
| First Letter | Succeeding Letters | ||||
|---|---|---|---|---|---|
| Measured or Initiating Variable | Modifier | Readout or Passive Function | Output Function | Modifier | |
| A | Analysis | Alarm | |||
| B | Burner | User's Choice | User's Choice | User's Choice | |
| C | Conductivity (Electrical) | Control | |||
| D | Density or Specific Gravity | Differential | |||
| E | Voltage (EMF) | Primary Element | |||
| F | Flow Rate | Ratio (Fraction) | |||
| G | Gaging (Dimensional) | Glass | |||
| H | Hand (Manually Initiated) | High | |||
| I | Current (Electrical) | Indicate | |||
| J | Power | Scan | |||
| K | Time or Time Schedule | ||||
| L | Level | Light (pilot) | Low | ||
Signal Types on PIDs
[140-1-13]
[image 140-1-14]