Contents
Reading
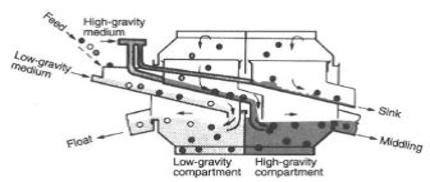
DM Vessels
- Utilizes a suspension of magnetite to adjust the medium density to a value that is between coal and the ash bearing material.
- The medium density correlates to the required separation density needed to achieve a desired product grade.
- Feed to a heavy media vessel is injected perpendicular to the elongated width of the vessel
- Float material travels across the vessel or is removed by a flight conveyor to one end.
- The high density particles sink and moved chain conveyor to other end.
[145-3-0]
Deep Baths
- Wemco Cone
- Tromp Vessel
- Chance Cone
Shallow Baths
- Peters
- Daniels
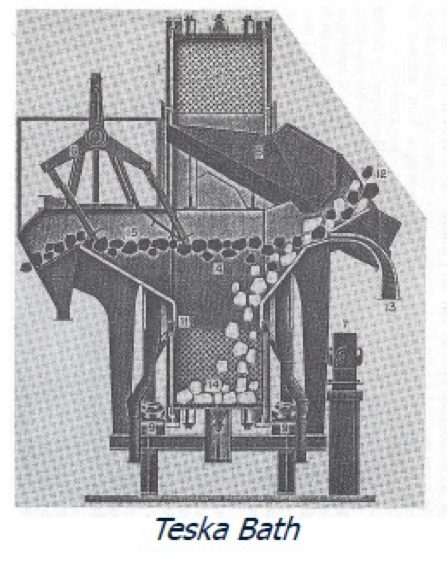
Drum Baths
- Teska
- Tromp
- Wemco
[image 145-3-0.1]
Shallow DM Vessels
This lecture will deal mostly with the Shallows Baths since they are the most common in the U.S.
Cost effective for +1/4-in raw coal feed.
- Low capital cost
- Low operating cost
- Ability to handle large amounts of refuse
- Adaptability to all types of coal
- Wide range of separating densities
- Very efficient of a broad particle size range
[145-3-1]
Daniels Dense Medium Vessel
[image 145-3-2]
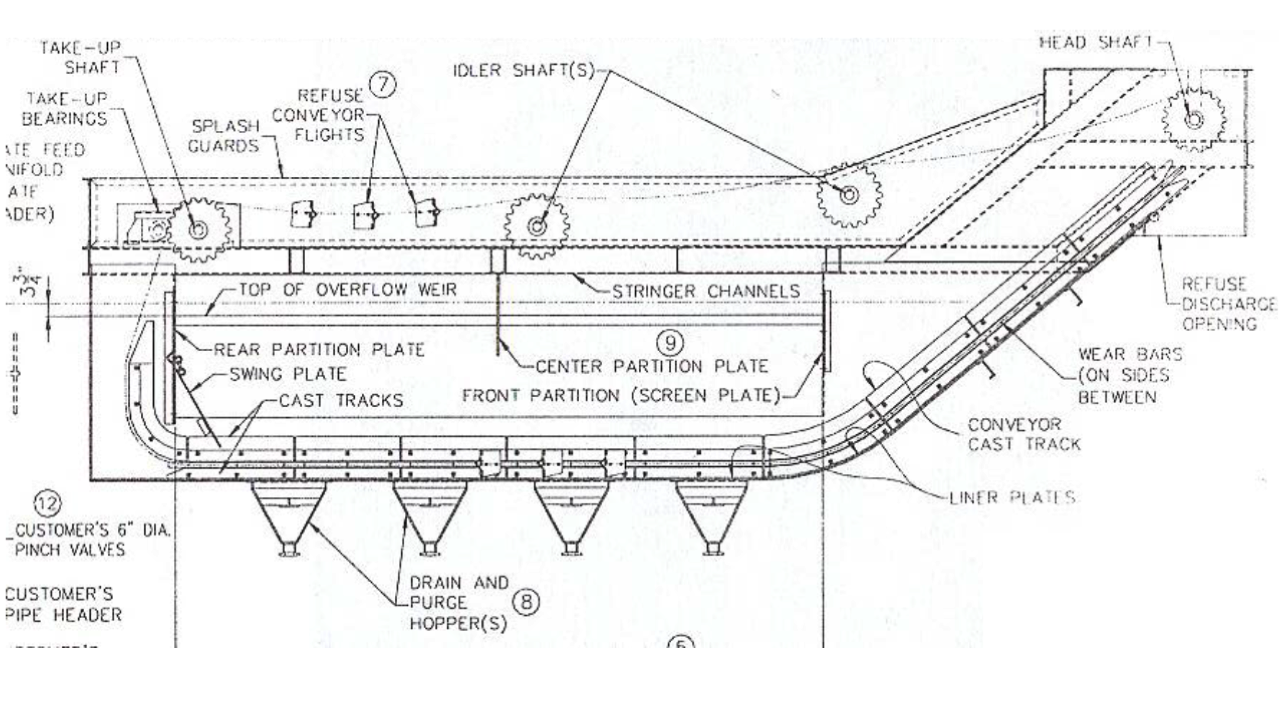
Shallow DM Vessel Sizing
- Length is based on how many feet of overflow weir is required to effective carry the coarse material into the product overflow stream.
- Width is established based on the amount of reject needed to be removed by the drag flight conveyors.
- A general rule is that the length should be based on 25 tons/hr of feed material for every foot of overflow weir.
- Example: A 500 ton/hr feed stream would require a 20-ft weir length.
- This rule is based on a separation gravity below 1.55 and a 50% yield to the product stream.
DM Vessel Width
- The width is based on the capacity of the flight conveyors which can be estimated by the following table.
Appropriate Refuse Capacity (short tons/hr) Height of Flights (inches) 48-in Conveyor Width 54-in Conveyor Width 60-in Conveyor Width 8 260 300 330 9 300 330 370 10 330 370 400 - Capacity values are based on a flight speed of 68 feet/min.
- Conveyor capacity could be increased by either a change in speed or an increase in the number of flights up to a critical value.
- However, the wear rates of the conveyor and vessel parts increase exponentially as the refuse chain speed exceeds 74 feet/min.
DM Vessel Operation
Prior to feeding coal to the DMV, the correct dense medium is pumped into the vessel through the feed washer manifold and the purge hoppers.
The vessel is filled until it is freely overflowing.
The proper inflow of medium can be estimated to be 260 gallons/min for every foot of overflow weir length.
- For example, a 15 ft weir length vessel would require a dense medium flow rate of 15 ft x 260 gpm/ft = 3900 gallons/min
- To check for proper flow, one can physically measure the fluid depth overflowing the weir. The proper depth is 3 ¾-in.
The coal is then fed to the HMV through the Feed Manifold.
The depth that the feed is injected should be minimized to avoid possible bypass of light particles to the tailings stream.
A feed sink plate is used to direct the feed downward into the vessel so that particles do not ‘raft’ across the width of the bath.
- If the refuse particles tend to adhere to the coal particles, the plate should be adjusted downward where higher currents are present.
- The plate is a high wear item and thus should be checked periodically.
Approximately 10% of the dense medium enters through the purge hoppers.
- Provides a gentle up-current which helps stabilize the medium.
- The purge hopper also serves as the drain when the HMV is shut down.
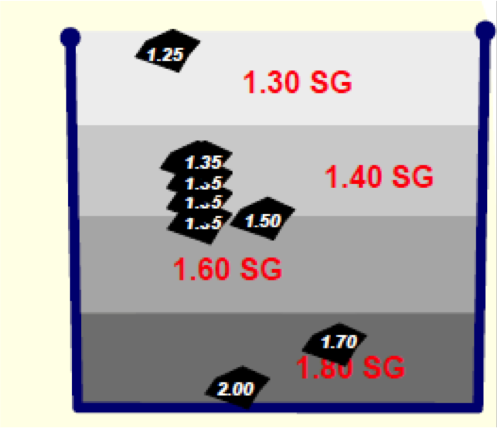
DM Vessel: Low Density By-Pass
Causes may include:
- In-sufficient upward flow medium;
- Plugged purge hoppers;
- Deep feed injection;
- Unstable medium;
- Overflow weir overload;
- False reading caused by laminated middlings.
260 gpm/ft of weir length.
10% of medium needs to report through the purge hoppers.
Overflow depth = 3- ¾ inch
Weir length = 25 tph/ft
[image 145-3-3]
DM Vessel: High Density By-Pass
Causes may include:
- Excessive upward flow of medium;
- Worn sink plate;
- Overload of high-density material in feed;
- Viscous medium;
- Excessive or un-equal medium flow in feed side manifolds;
- Large amount of material below the bottom size in the feed.
Adequate conveyor capacity is needed by flight number, dimensions and speed.
Medium contamination less than 10%.

[image 145-3-4]
Dense-Medium Cyclones (DMC)
Dense medium cyclones (DMC) have been found to be effective in treating particle size fractions between 3-inch and 100 mesh, however, not typical done in a single unit.
The DMC application for treating 16 x 100 mesh material is limited due to significant magnetite loss resulting from inefficiencies on the drain-and-rinse screens.
The ability to treat particle sizes from 3 to 1 inch is a result of the development of large diameter DMC units in the late 1990’s. Cyclone diameters greater than 1 meter are currently available having mass throughput capacities approaching 500 tons/hour.
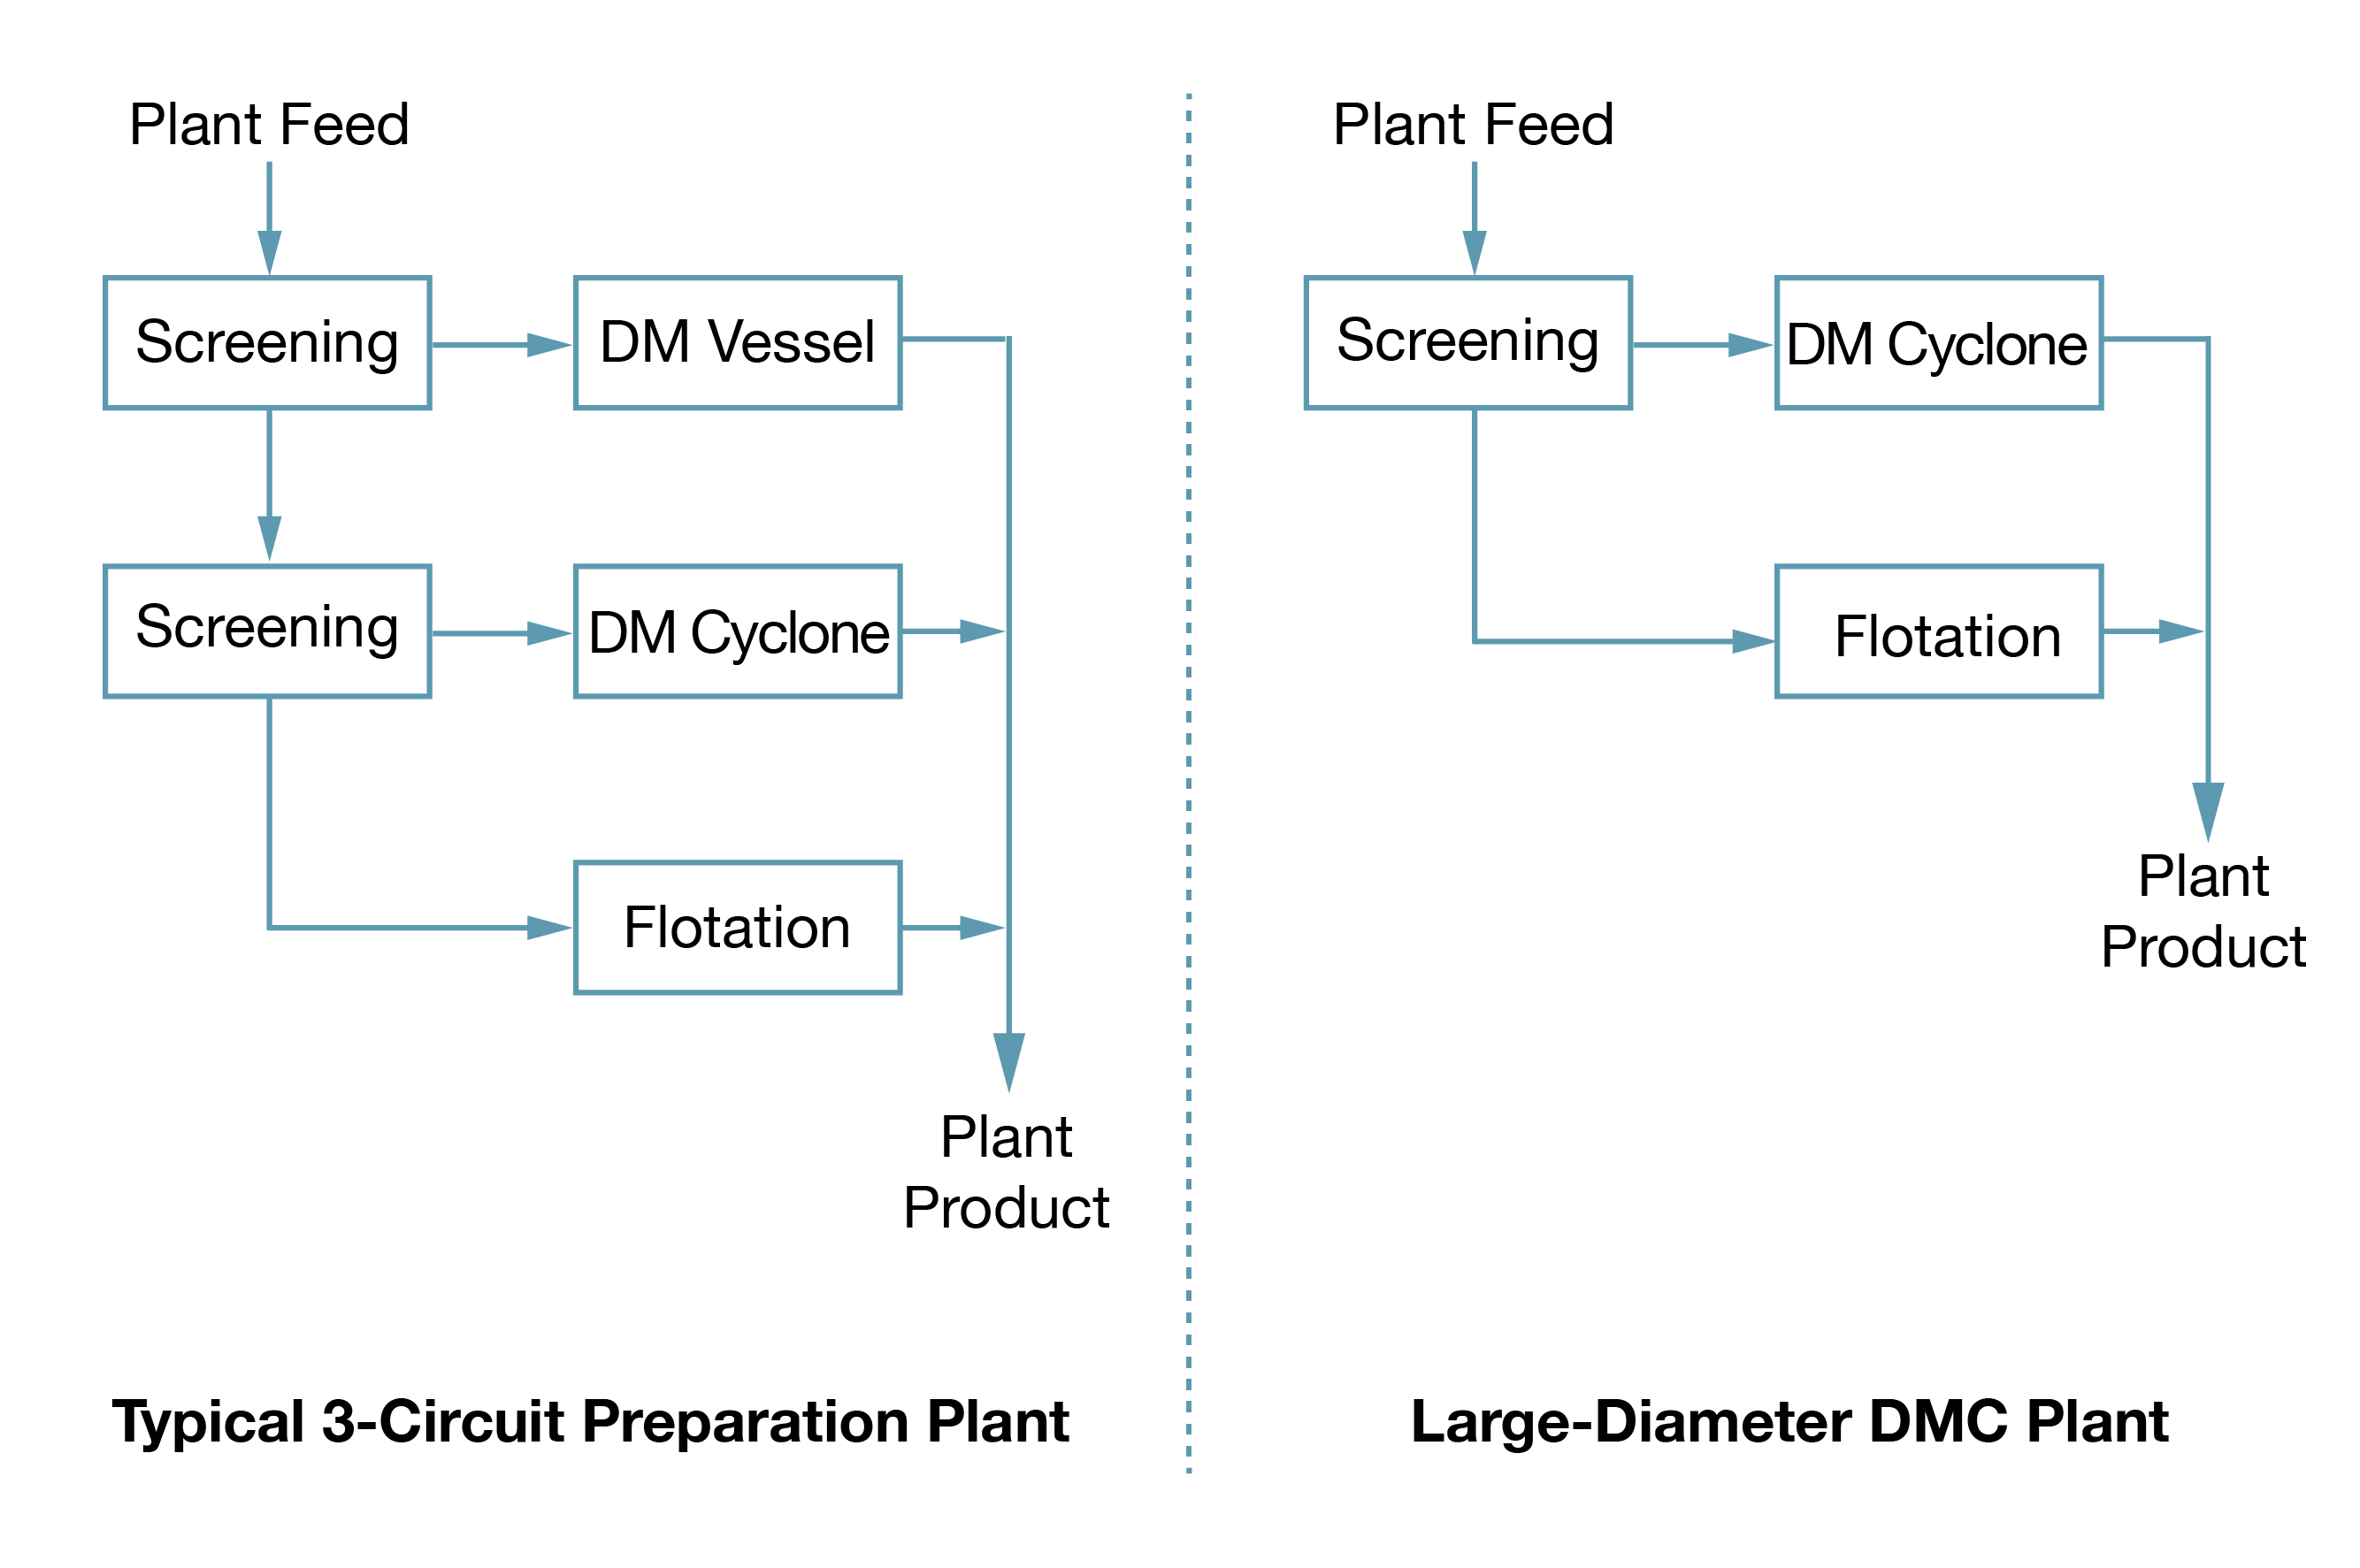
DM Circuit Trends
The ability to efficiently treat a large particle size range of 3 inch to 16 mesh in one process unit has revolutionized the design of coal preparation plants by reducing the number of required circuits.
[image 145-3-5]
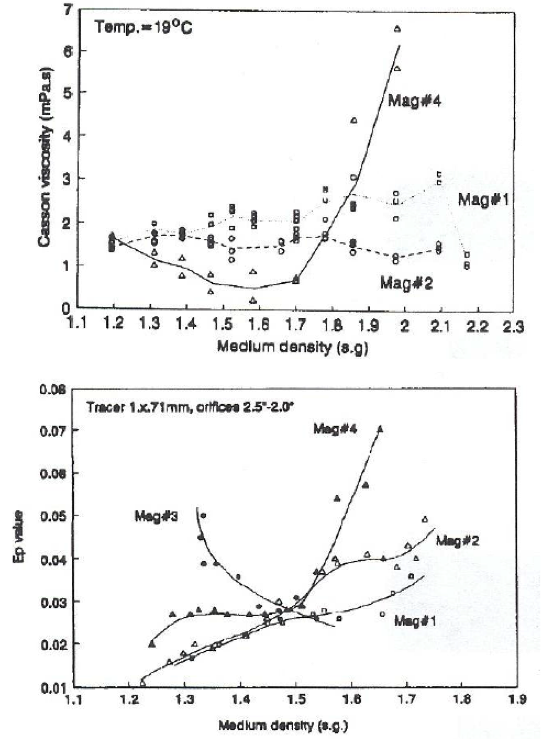
Large Diameter DMC Performance Comparisons
| Goonyella | Riverside | |||
|---|---|---|---|---|
| Particle Size (mm) | Twin 710 mm Cyclones Ep | Single 1 m Cyclones Ep | Twin 710 mm Cyclones Ep | Single 1 m Cyclones Ep |
| +16 16 x 4 4 x 2 2 x 0.5 | 0.028 0.030 0.038 0.055 | 0.025 0.026 0.028 0.045 | 0.020 0.025 0.045 0.070 | 0.014 0.020 0.026 0.049 |
16 mm = 4 in.; 4 mm = 1 inch; 2mm = 0.5 in.; .5 mm = 0.127 in.
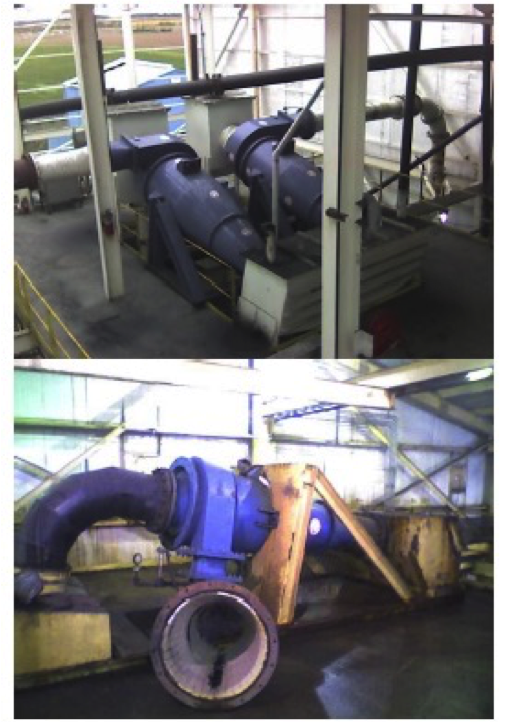
DM Cyclone
Like classifying cyclones, an air core is needed through the middle of the cyclone to ensure proper directional movement of the inner fluid toward the Vortex Finder.
Unlike classifying cyclones, DMC units must be installed in a near horizontal position, which is typically 10o from horizontal.
[145-3-6]
DM Cyclone Operation
The reason for the near horizontal position is that, in the vertical position, the gravitational pull on the dense medium results in a slumping of the medium toward the apex, which pinches the air core.
Under a ‘slumping’ condition, the separation efficiency would be very sensitive to inlet pressure and medium viscosity.
Other factors favoring a horizontal orientation include the ease of piping for both gravity-fed and pump-fed systems and a reduction in head-room requirements.
DM Cyclone Dimensions — DM Cyclone Diameter, Dc
| Inlet Diameter, Di | = | 0.20 x Dc |
| Vortex Finder Diameter, Do | = | 0.43 x Dc |
| Apex Diameter, Du | = | 0.30 - 0.40 x Dc |
| Inlet Pressure | = | 10 - 20 psi |
| Included Angle | = | 20° |
| Inclination Angle | = | 10° |
| Feed Medium-toCoal Ratio | = | 5:1 |
Operating Conditions
Critical Parameters for Good Heavy-Media Cyclone Operation
- Operation Head
- Media Splits
- Media Quality
- Orifice Diameters
- Internal Geometry
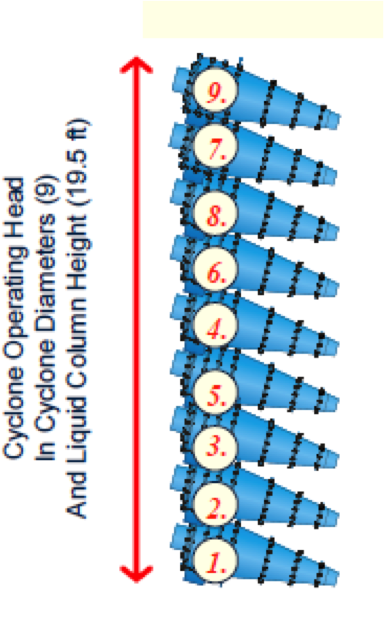
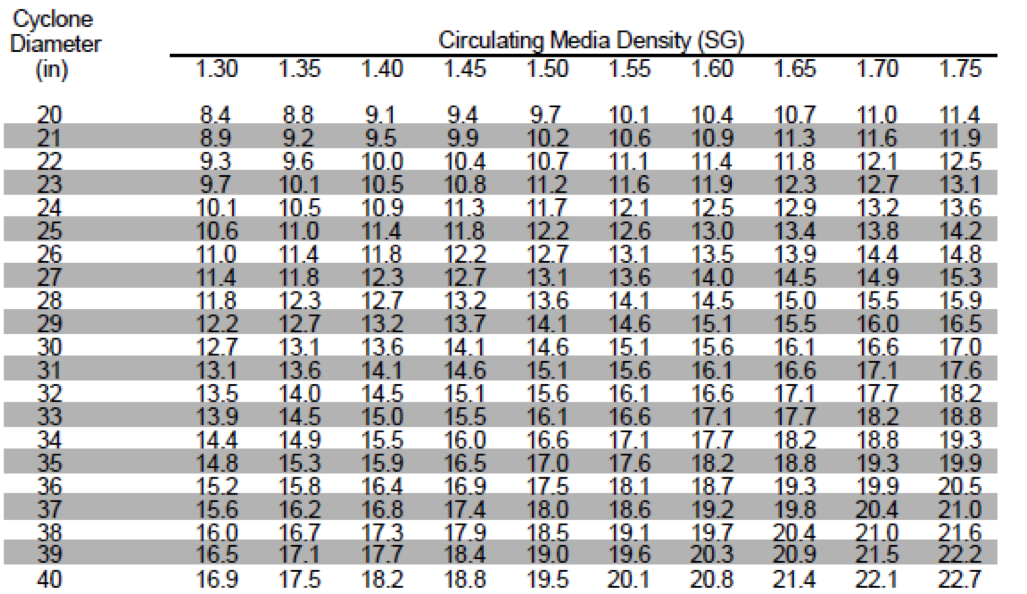
Operating Head (pressure)

[image 145-3-7]
Gauge Pressure to Operating Head
Operating Head
- Nominal Operating Head = 9 Cyclone Diameters
Example:
8.26’ Ø ÷12 x 9 Dc = 19.5 Ft. of Head (LCH)
- Always Convert Gauge Pressure to Feet of Head.
Example:
12.7 PSIG ÷ 1.50 SG = 8.47 PSIG (H2O)
8.47 PSIG x 2.31 = 19.5 ft of Head (LCH)
Operating Conditions Can Trim Head Requirements
- High Densities or Large Inlets May Permit Higher operating Heads
- Lower Densities or Small Inlets May Require Lower Operating Heads
- Important to Consult Supplier on these Issues
[image 145-3-8]
Required Feed Pressure @ 9 Operating Heads
Heavy-Media-Cyclone Pressure Required to Maintain 9 Dc at Various Media Densities
[image 145-3-9]
Media Split
- Generally Media Split Should Follow Coal Yield on a volume Basis
- Lower Densities Normally Require Lower Media Splits to Overflow
- Decision to Adjust Media Split Requires Careful Study
- Media Split Influenced by Coal Yield
- Normally, Media Split Change Related to Apex Enlargement.
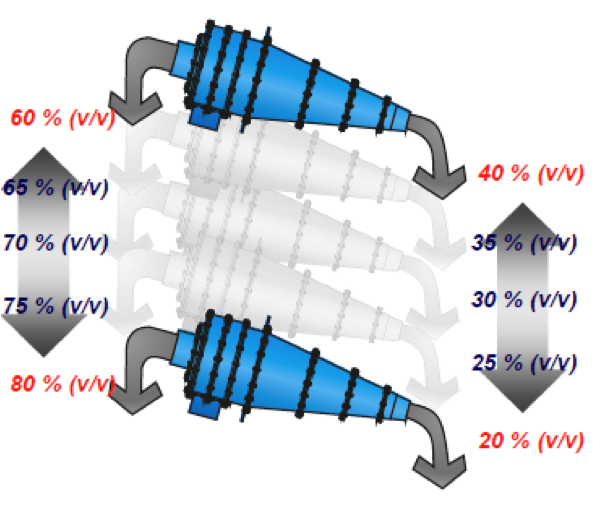
[image 145-3-10]
Measuring Media Split
- Measure Media Density of Feed, Overflow, and Underflow Media
- Calculate Media Split by the following Equation:

Typical Feed Volumetric Capacities
| Dense-Medium Cyclone Diameter (inches) | Volumetric Feed Rate (gallons/min) | Feed Mass Flow Rate (tons/hr) |
|---|---|---|
| 20 | 1325 | 75 |
| 26 | 1750 | 140 |
| 30 | 2600 | 208 |
| 33 | 3800 | 304 |
| 40 | 5200 | 416 |
DM Cyclone Circuit

[145-3-1]
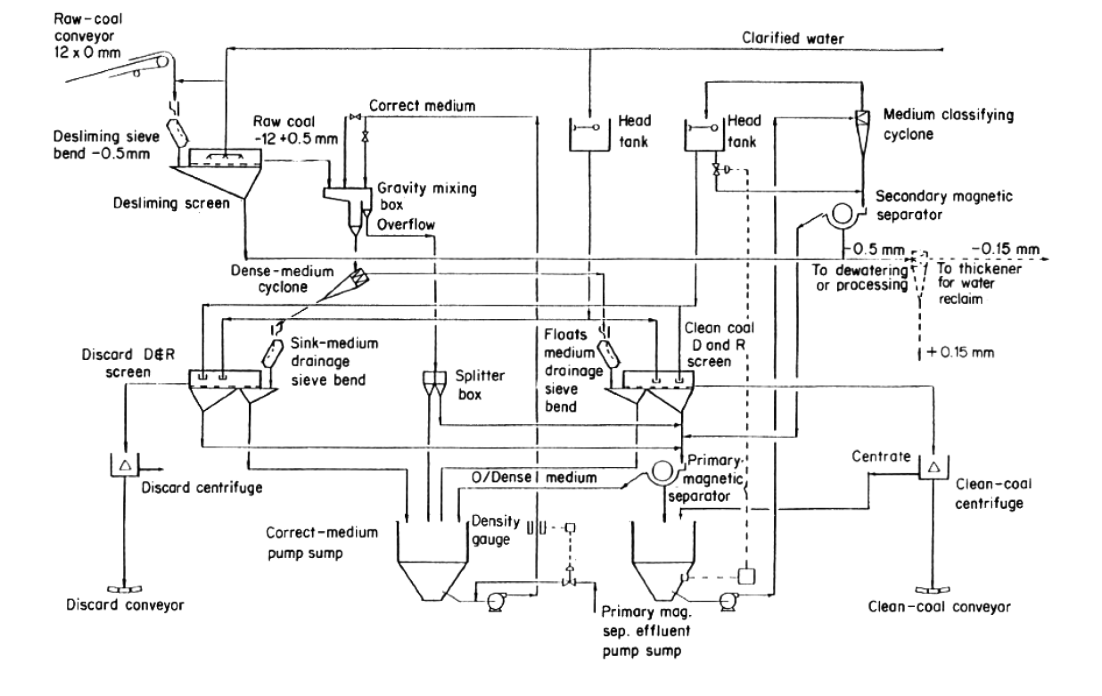
[image 145-3-13]
Operating Condition Factors
Feed Pressure
Low feed pressures of 10 to 20 psi are used to maintain a stable magnetite suspension and reduce wear.
However, excessively low pressures can lead to high density particles, especially slab shaped, by-passing to the overflow product stream.
Feed Flow Rate
The volumetric feed flow rate that can be processed by a DMC is a function of
- Cyclone diameter strongly;
- Feed pressure strongly;
- Apex diameter slightly.
Interestingly, medium density has no effect on feed rate.
Medium-to-Coal Ratio
Medium -to -Coal Ratio=Volume of Medium: Volume of Coal
For example, the feed rate to a DM separator is 400 ton/hr of coal which has a relative density of 1.60. The desired medium to coal ratio is 5:1. Determine the amount of medium needed in gallons/min with the example below:
Coal Volume = (400 tonsâ„(hr) (2000 lbsâ„ton)) / ((62.4 lbsâ„ft3 ) (1.60) (60 minâ„(hr))(0.1337/ft3â„(hr)))=999 gpm
Medium requirement = 5 x 999=4995 gpm
The ratio minimum in the feed is related to hindered settling effects. High solid concentrations slow the movement of particles to their respective process streams leading to inefficiencies
Apex-to-Vortex Diameter Ration
As you may recall, it is advantageous to minimize the Apex-to- Vortex Finder diameter ratio (DU/DO) to reduce the effects of ultrafine by-pass.
In DMC units, the DU/DO ratio is generally higher and can approach a value of unity.
As the DU/DO ratio approaches unity, the overflow rate falls and the underflow rate increases.
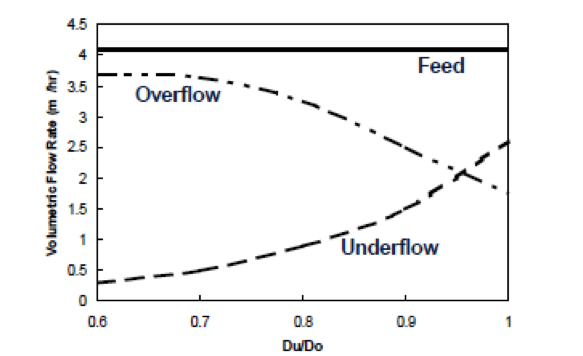
[image 145-3-14]
DM Cyclone: High Density By-Pass
Causes may include:
- Vortex Finder Wear;
- Low feed pressure;
- High Vortex: Apex
- diameter ratio;
- High feed M:C ratio;
- Overload of high-density
- material in feed;
- Viscous medium;
- Large amount of material below the bottom size in the feed.
To ensure proper operation, the medium-to-coal ratio in the underflow should be maintained above 1:1.
Medium contamination less than 10%.
[image 145-3-4]
Causes include:
- Vortex Finder overload;
- Apex Wear;
- Unstable medium.
Vortex Finder Overloading exists when the vortex finder is too small to accept all of the floatable material reporting in the feed stream.
When a low volumetric amount of medium reports to the overflow, coarse low- density particles are unable to exit.
Medium-to-coal ratio in the overflow stream should be maintained above 2.5:1.
Medium split should approximately equal the medium split.
[image 145-3-3]
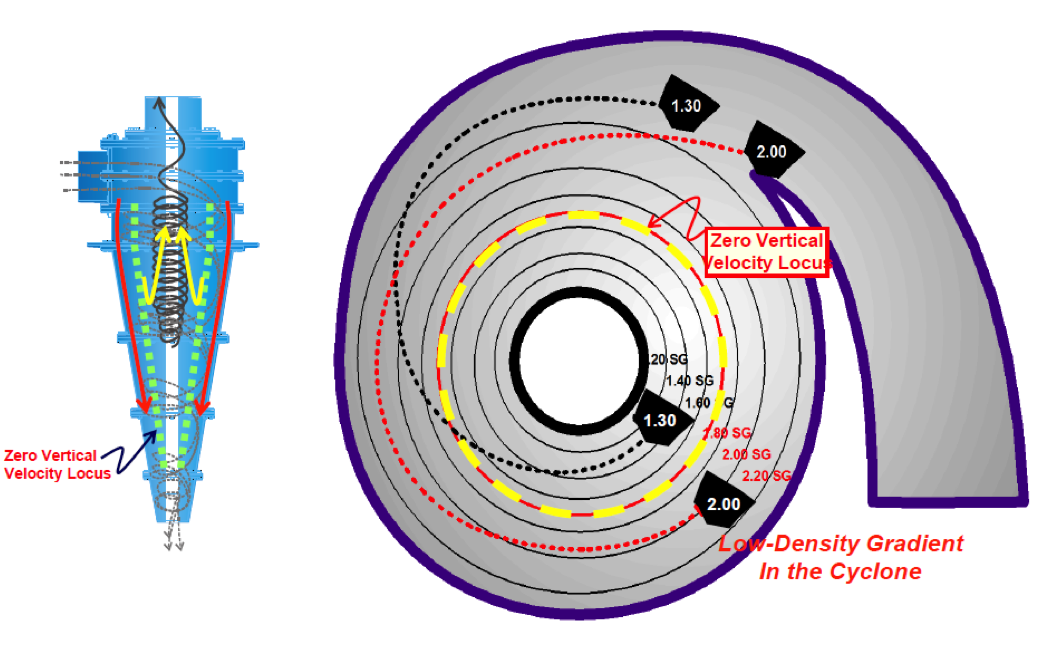
Particle Retention & Surging
Particle retention in DMC units occur due to density gradients being formed within the unit.
Retention occurs because particles of a given density, typically the middle density fractions, have the inability to penetrate the high density layers and report to the underflow stream. As such, they remain trapped between density layers.
If the feed medium-to-coal ratio is low (< 6.0) and the feed contains significant amounts of near density material, the amount of particle retention can be significant.
However, as long as the particles are continuously removed through one stream or the other, the effect of particle retention is minimal.
Large particles, however, tend to build up large loads in the cyclone and then spontaneously release the load through the apex. This process is called surging and rarely occurs when the feed top size is below 15 mm.
[image 145-3-15]
Cond. #1: Low-Density Gradient (Stable Medium)
[image145-3-16]
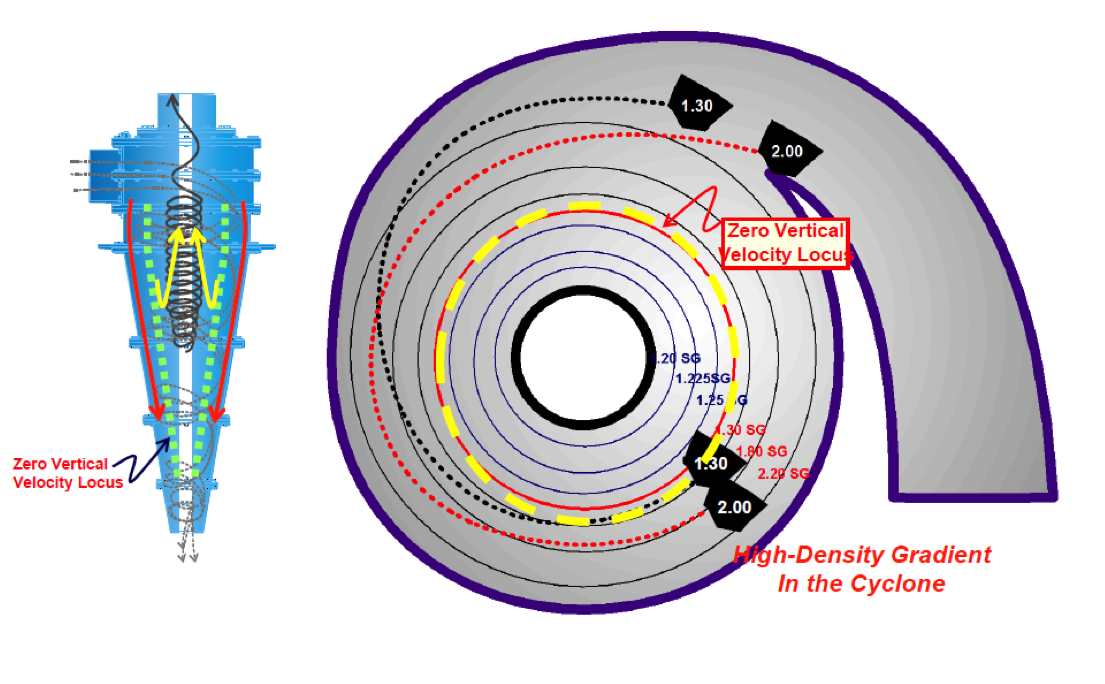
Cond. #1: High-Density Gradient (Unstable Medium)
[image 145-3-17]
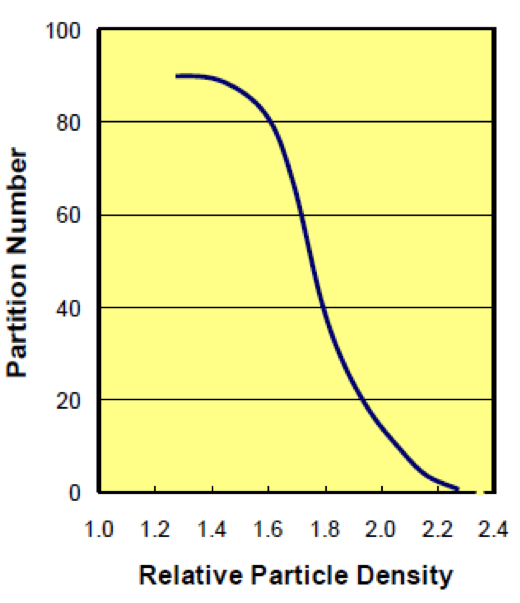
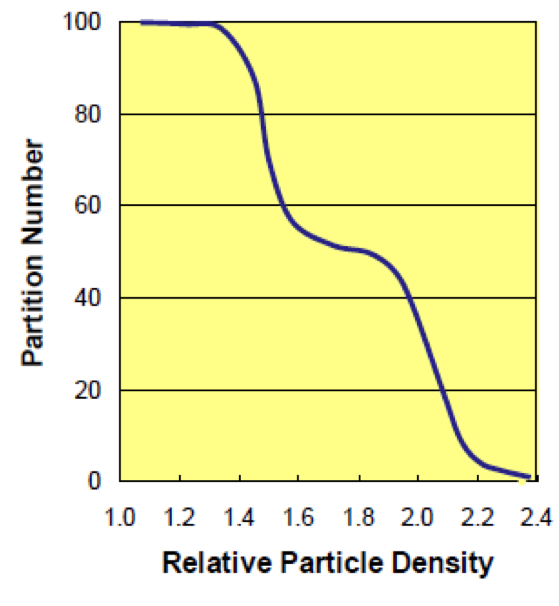
Particle Retention and Surging
Coarse particle retention and surging are characterized by the following partition curve.
To reduce or eliminate particle retention, the difference between the medium density of the overflow and underflow streams (Ïu — Ïo) should be less than 0.40 RD units.
To reduce the density difference, the following actions can be used:
- Reduce inlet pressure;
- Reduce magnetite particle size;
- Increase DMC diameter;
- Increase apex diameter;
- Increase the feed medium- to-coal ratio;
- Reduce feed particle size
[image 145-3-18]
High Medium Viscosity
He and Laskowski showed how medium viscosity negatively affects efficiency.
Increase in medium density and contamination as well as a decrease in magnetite particle size elevates viscosity.
Less than 20 centipoise is recommended.
Results in:
- Low medium differential;
- Low ash in the finer fractions of the rejects;
- High ash in the finer fractions of the clean coal product.
[image 145-3-18]
DM Cyclone Design
The following model was developed by the JKMRC Research Center in Australia and described by Chris Wood (1990).
The model and steps of the scale-up procedure will be presented through the development and solution of an example problem.
DMC Design Example:
A preparation plant is being designed to treat 700 ton/hr of ROM coal containing an average of 5% moisture (air-dried basis). A nominal 30 x 0.5 mm fraction comprises 80% of the total ROM feed and will be cleaned using DMC units. The required product grade is 7.5%. The washability analysis of the feed material is provided in the following table.
Solid Density Determination

[145-3-21]
Step 1: Estimate the Required Separation Density and Yield
- Determine from washability data the mass yield and relative density required to achieve the desired product grade.
- In the example, a relative density of 1.39 will provide the required 7.5% ash content while recovering 69% of the feed mass.
Step 2: Estimate the Densities of the Feed, Clean Coal and Rejects
- The average densities of the feed, product and tailings can be estimated from the washability data since high accuracy is not required in this step.
- In this manner, the average densities are determined for each density fraction in the feed and the overall average density is obtained by the summation of the mass units divided by the sum of all volume units comprising the given material.
- For the feed, the average relative density is 1.45 which is obtain from the column (i) at 100% yield.
- In similar manner, the clean coal density achieved with a 1.39 separation density is approximately 1.31.
- Thus, the tailings density can be determined using a volume conservation balance expression:
Density of sinks = 1.93
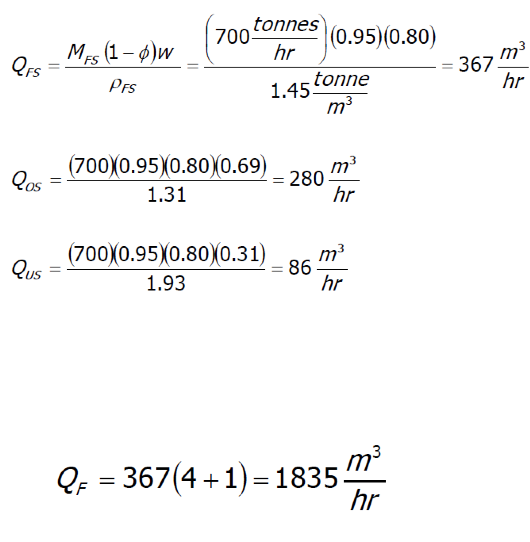
Step 3: Flow Rates of Feed, Overflow (Clean Coal) and Underflow (Reject)
- The volumetric rate of solids in each process stream, which excludes medium, can be determined by relating mass flow to the DMC units to the average density of each stream.
- w is the fractional content of feed in the given size fraction and Ñ„ the fractional surface moisture.
- Based the feed flow rate and a feed medium-to-coal ratio of 4:1, the minimum feed slurry flow rate, QF, can be determined.
[image 145-3-22]
Step 4: Selection of the Number and Geometry of DMCs
- To avoid blockages in the cyclone inlet, it is recommended that the 95% passing size of the feed not exceed (0.05 x DC).
- Therefore, in the example, the cyclone diameter should be at least (30 mm/0.05) = 600 mm. Thus, for a 610 mm cyclone, the inlet diameter will be (0.2 x 610 =) 122 mm.
- Since the volumetric split of feed solids is approximately 23% to underflow and the common apex diameter is (0.10 x DC) only passes 10% of the feed volume to the underflow, a larger apex of 0.35 x DC will be considered.
- According to the JKMRC DMC model, the volumetric flow rate to a DMC can be estimated by the following expression:
Qf = 2.87 (10– 5) DC2.30 Ï0.46 [Du/Do]0.17
- In which Dc, Du and Do are the cyclone, apex and vortex finder diameters, respectively (mm) and P the inlet pressure expressed in terms of cyclone diameters.
Step 5: Feed Volumetric Capacity
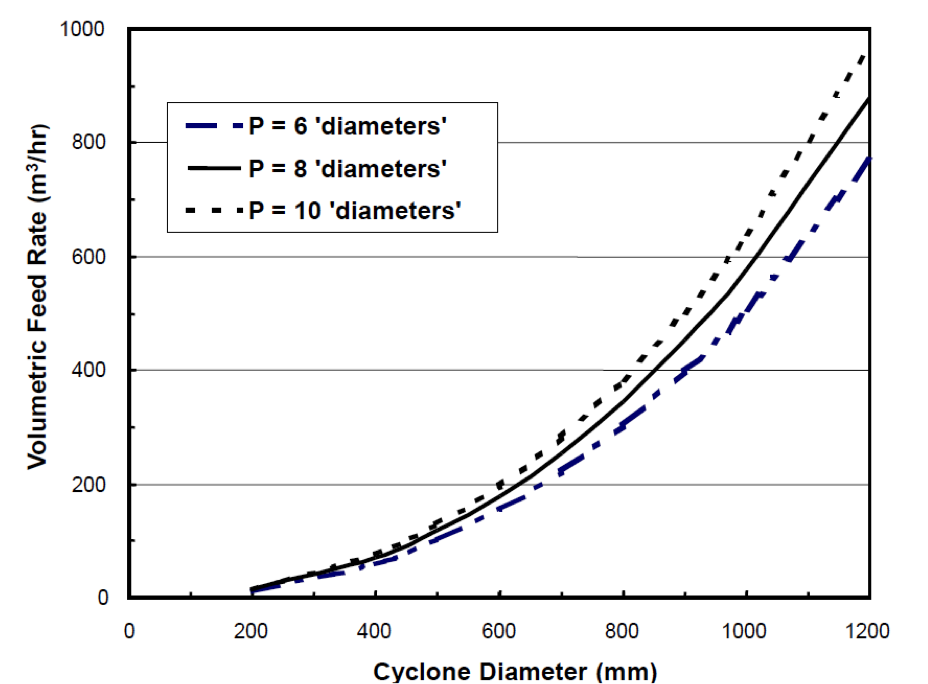
[145-3-23]
- The inlet pressure in terms of ‘cyclone diameters’ can be determined from a gauge placed on a cyclone at a vertical distance s. The reading in kPa can be used to determine the required units of P using the following expression:
where the vertical distance above the cyclone, s, is in mm and rfs is the relative density of the feed slurry, which can be approximated by the medium density.
- Three commercially available cyclone diameters will be evaluated in an effort to select the optimum size, i.e., 610, 711 and 813 mm.
- Using P = 9 diameters, the flow rates and the required number of cyclones for treating QF = 1835 m3/hr was determined and the data provided in the following table
| Required Capacity (m3/hr) | Dc (mm) | QF (m3/hr) | Required Number of DMC units | Excess Capacity (%) |
|---|---|---|---|---|
| 1835 | 610 | 193 | 10 | 5 |
| 1835 | 711 | 276 | 8 | 20 |
| 1835 | 813 | 374 | 6 | 22 |
- With the 711 and 813 DMC units, sufficient capacity could be provided by 7 or 5 units, respectively.
- Plant layouts typically use DMC units in pairs, so 6 and 8 units were chosen for the two larger cyclones.
- Selection between the options would be based on expected over capacity needs, raw coal distribution problems and costs of pumps, screens and other ancillary equipment.
- For this example, eight 711 mm cyclones will be selected.
- The volumetric yield of feed slurry to the underflow stream can be determined using the expression:
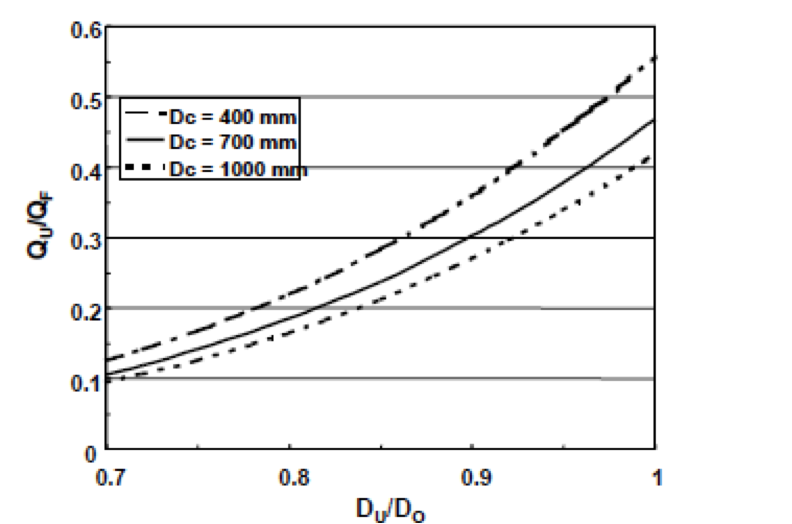
Volumetric Feed Yield
[image 145-3-24] - In the example, the volumetric split is:
- Thus, the volumetric flow rate to the underflow and overflow streams of each cyclone in the example are:
- Medium-to-Coal ratio is essentially a measure of the percent solids in the slurry if one considers the magnetite suspension a pure fluid.
- As such, the ratio is determined on a volumetric basis.
QFS is the total volumetric flow rate of solids (no medium) that is required to be treated by DMC units, QF the volumetric slurry feed flow rate for each cyclone under the given conditions and n is the total number of cyclones.
- As shown, each of the medium-to-coal ratios are above the minimum recommended values needed to avoid surging and vortex flow problems.
- A minimum of 2/3 of the medium should report to the overflow to ensure the ability to recover the coal to the vortex by using a smaller apex.
Step 6: Magnetite Grade, Underflow & Overflow Medium Densities and Differential
- As described previously, it is important that the medium density between the underflow and overflow streams be maintained at a value less than 0.4 to minimize the negative effects of particle retention and surging.
- As expected, the fineness of the magnetite has a critical role in determining the density difference and the parameter p in the model reflects the Rosin-Rammler intercept.
- Finer magnetite reduces the differential, however magnetite recovery becomes a concern.
- In considering the density differential, one must be concerned with the required medium density (Ïm) with respect to the estimated separation density (Ï50) as determined from wash ability analysis.
- Typically, (Ï50 — Ïm) is approximately 0.10. Therefore, in our example, Ïm= 1.29.
- The expressions developed to estimate the underflow (Ïu) and overflow (Ïo) density values (minus the coal) are:
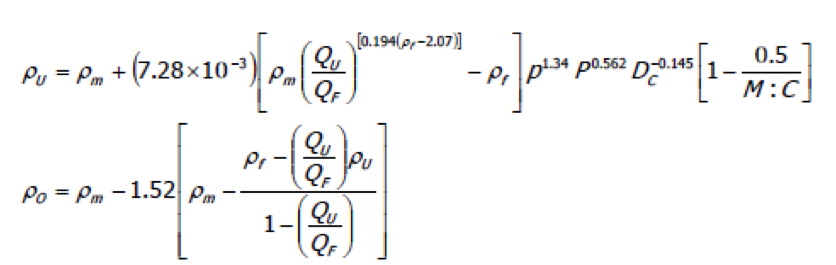
Expressions to estimate underflow and overflow density values.
[image 145-3-25] - Typically, a medium density of 1.29 is considered low and suspension stability concerns exist. Use of an ultrafine magnetite may be needed.
- However, let us consider a coarser ‘superfine’ magnetite first, which, if proven applicable, would reduce magnetite losses. For a superfine magnetite, p (i. e., the 63.2% passing size) is 31 microns.Therefore, (ÏU — ÏO) is 0.54, which is too high and would lead to severe particle retention and surging.
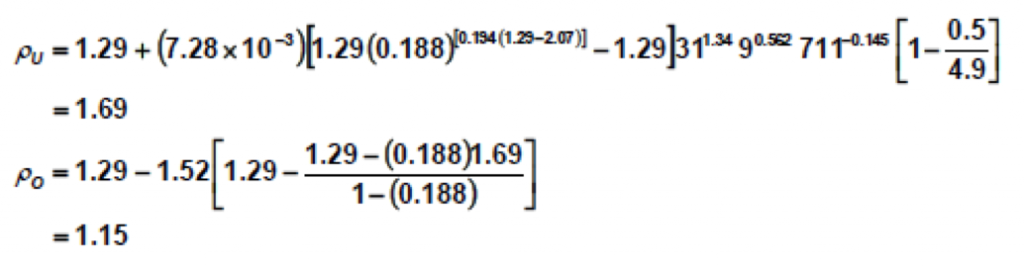
Application with magnetite
[image 145-3-26] - As such, a finer magnetite should be considered. The p value for a typical ultrafine magnetite is 26 microns.
- Redoing the calculations results in:ÏU =1.54ÏO=1.20
- Thus, the finer magnetite reduced the differential to 0.34, which is within the acceptable range

Step 7: Feed Medium Density Check
- To check the selection of the feed medium density was correct, which was based on an approximation of the difference between the required separation density and the medium density, the following expression is utilized:Ï50= Ïm +0.125+0.154 Ïu-0.215 Ïo
= 1.29+ 0.125 +0.154(1.54)-0.215(1.20)
= 1.39 - Since 1.39 is the desired separation density, we can stop.
- However, if the value did not equal the required density, step 6 would be repeated with a different Ïf value until agreement is realized.
- This separation density value reflects performance achieved on the +4mm particles while finer particles are expected to achieve higher values.
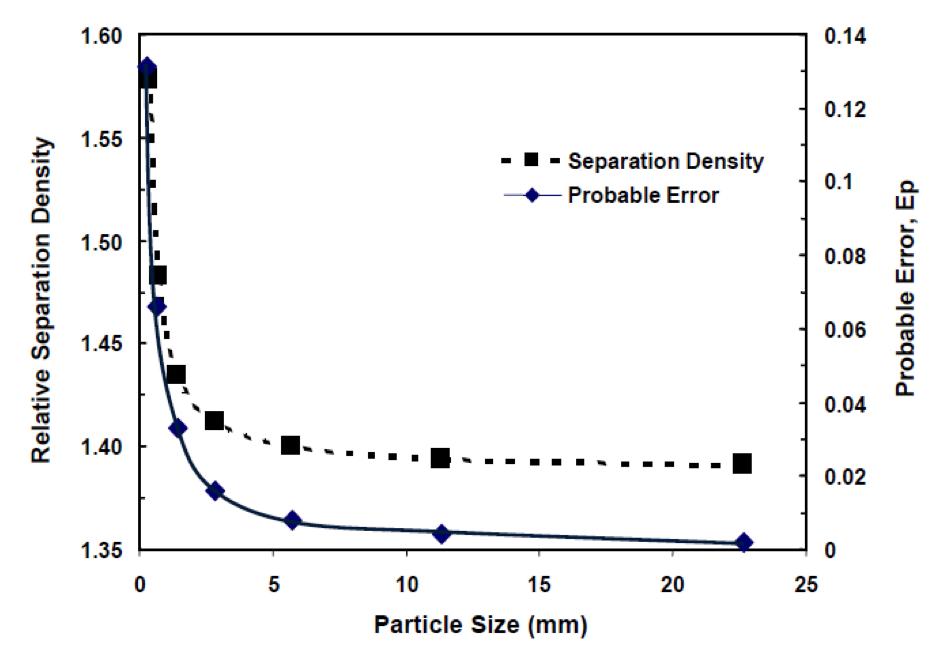
Step 8: Separation Performance Predictions versus Particle Size
- From the empirical data, researchers at JKMRC developed the following relationship which shows the separation density (Ï50d) achieved on each particle size fraction (mean size =d in mm) below 4 mm as compared to the separation density predicted for the +4 mm (Ï 50):Ï50 d = Ï50 + 0.0674 [1/d – 1/10]
- The corresponding probable error for each fraction can be estimated from the expression:Ep=0.033 Ï50 / d
Separation Density & Efficiency vs. Particle Size
[image 145-3-27]
- Quality generally described by the % -44 micron.e.g.;
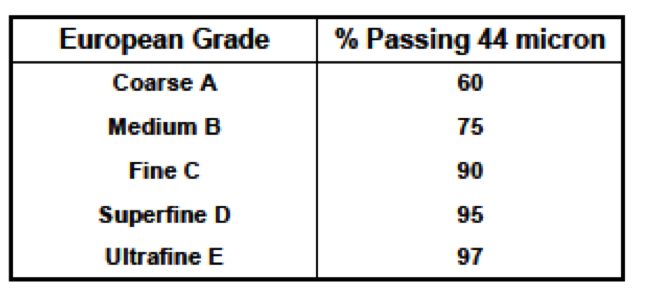
Quality grades
[image 145-3-28] - U.S.Grade B =95% passing 44 microns is most often used
- Required magnetics content >97%.
Magnetite Amount Required
- Determination of the required amount per 1 m3 of water
Density of Water = 1000 kg/m3; 1 m3 of Water = 1000 kg
Magnetite Density = 5170 kg/m3

[image 145-3-29] 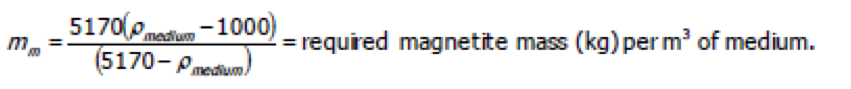
[image 145-3-30]
- For example, a 400 tph feed to a dense medium process equates to a volumetric flow rate of 1000 gallons/min or 3.785 m3/min. At a 4:1 medium-to-coal ratio, the volume of medium is 15.14 m3/min.
- To achieve a Ïm = 1.50 RD, the required amount of magnetite in the medium is 704 kg per m3 of medium or 10664 kg/min = 10.7 tonnes/min.
Magnetite Losses
Magnetite costs have become a significant operating expense with the prices ranging from $160-$300/ton.
Magnetite loss ranges from 0.50 — 3.0 kg/tonne of feed (1 — 6 lb/ton) and will depend on:
- Fineness of the
- magnetite;
- Fineness of the coal;
- Magnetic separator
- efficiency;
- Magnetite recovery circuit design.
Most of the loss occurs at the drain and rinse screen.
[image 145-3-31]
The majority of the lost magnetite is associated with adhesion to the particles in the clean coal and reject streams.
An expression was developed by the Dutch State Mines researchers that quantifies the amount of magnetite Qm (liters/ton) adhering to the coal and reject as a function of particle size ds (mm) and density Ïs:
For example, consider the typical particle size ranges reporting to the dense medium vessel (100 x 10 mm) and dense medium cyclones (10 x 1 mm). The arithmetic mean particle sizes are 55 mm and 5.5 mm, respectively. The relative particle density is about 1.35.
Vessel Product:
Dense Medium Cyclone Product:
Obviously, if drainage only was used to recover the magnitude, a tremendous magnetite loss would be realized, even for the coarse coal application.
Typical losses: 0.5 kg/ton of coarse feed and 1.0 kg/ton of fine feed.
Rinse Water Requirements
- The rinse screen portion of the drain-and-rinse screen used to recover magnetite uses shower boxes and water sprays. Water boxes tend to be more efficient for magnetite recovery.
- The amount of water required is a function of the screen area and varies between 20 m3/hour/m of screen width to 65 m3/hour/m.
- The amount of water is less for the shower box as compared to water sprays as shown by the following equations, which were developed by the DSM researchers
Water Sprays:
- Typically, sprays are used for the coarse products where the total screen area is low while shower boxes are employed in fine particle rinsing.
- Water is added in stages. About 4/5ths of the water is recirculation water, generally from the overflow of the magnetic separators.
- Clean water is added in the last sprays/boxes just prior to discharging the screen.
- The capacity of a drain-and-rinse screen can be estimated by the Sauter diameter, which is a measurement based on the amount of particle surface area.
- The Sauter diameter is determined by dividing the mass in each size fraction by the mean particle size of the size fraction, which essentially provides the average amount of surface area for a given amount of mass.
| A | B | C | D | C/D |
|---|---|---|---|---|
| Particle Size Fraction | Opening (mm) | Weight (%) | Arithmetic Mean Particle Size | |
| 3/8" x 4M | 4.76 | 15.56 | 7.14 | 2.18 |
| 4M x 8M | 2.36 | 12.13 | 3.56 | 3.41 |
| 8M x 16M | 1.18 | 8.45 | 1.77 | 4.77 |
| 16M x 30M | 0.60 | 5.55 | 0.89 | 6.24 |
| Total | 41.69 | 16.60 | ||
| Sum (C/D)/41.69 = | 0.398 | |||
| Sauter Mean Diameter = | 2.51 | |||
- Total length is about 4.8m long with the first 1.2m being a sieve bend with 0.5mm openings and 3.6m being a horizontal screen.
- Typical sieve bend capacity = 105 to 135m3/h/m2 of screen area.
- The drain-and-rinse screen capacity can be estimated by the following formula:
Dutch States Mine Equation
C = screen discharge capacity (tons/hr/ft of effective width)
Ïs = relative density (sp.gr.) of the solids
Ao = open area of screen surface
- The D&R screen capacity determined from the equation can be multiplied by a factor of 1.4 to estimate the capacity of banana screens in a drain-and-rinse application
- Effective width = Nominal width – 0.5ft
- Example: Clean coal drain-and-rinse screen, Ïs = 1.35
=15.6 tons/hr/ft
8ft screen = 117 tons/hr
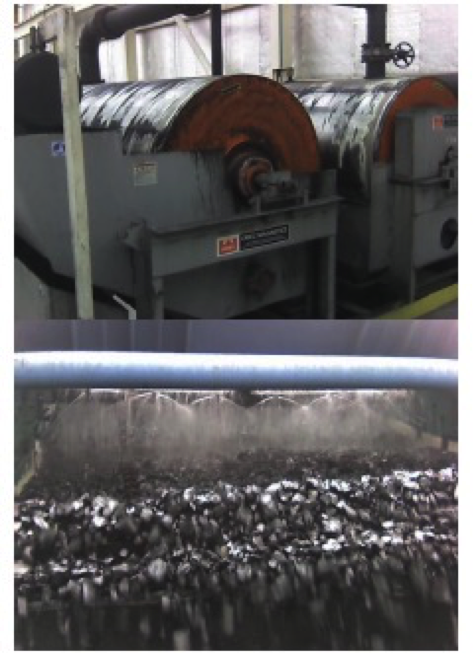
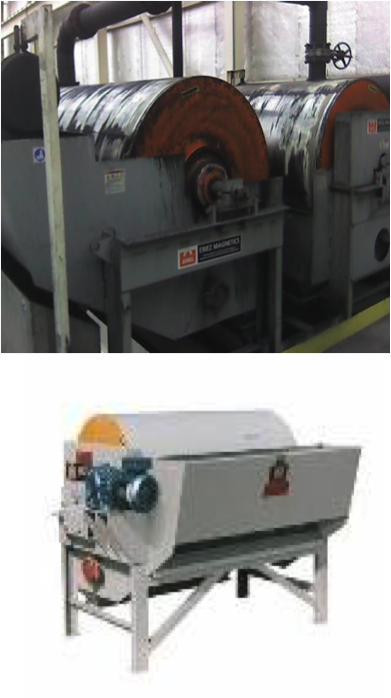
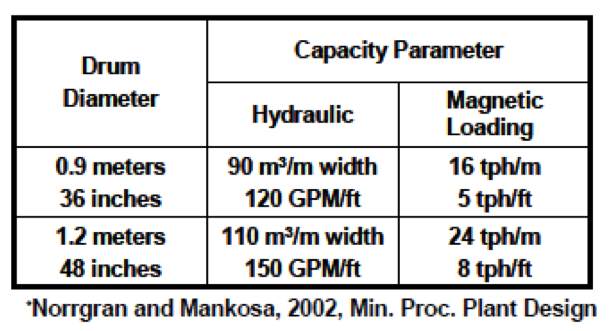
Magnetic Separators
Typically a Wet-Low Intensity Drum Separator.
- Approximately 750 Gauss (High-Gradient Rare Earth Drums = 21,000 Gauss or 2.1 Tesla.
Commonly employ 0.9 and 1.2 meter diameter units that range up to 3 meters in width
Two types of tank styles exist, i.e.,
- Concurrent
- Counter-rotation
The counter-rotation unit is the most popular due to elevated magnetite recovery.
[145-3-32]
Magnetic Separator Capacity
In the counter-rotation unit, the drum rotates against the inward flow of dilute medium. As the medium passes through a slot having a preset depth, magnetite is attracted to the drum. The drum can be adjusted to obtain different medium depths.
Losses are typically no more than 0.25 grams/liter of non-magnetic product.
Wet Drum Capacity in Dense-Medium Recovery Applications Counter-Rotation; Grade E Magnetite; Feed Solids < 13% by weight.
[image 145-3-33]
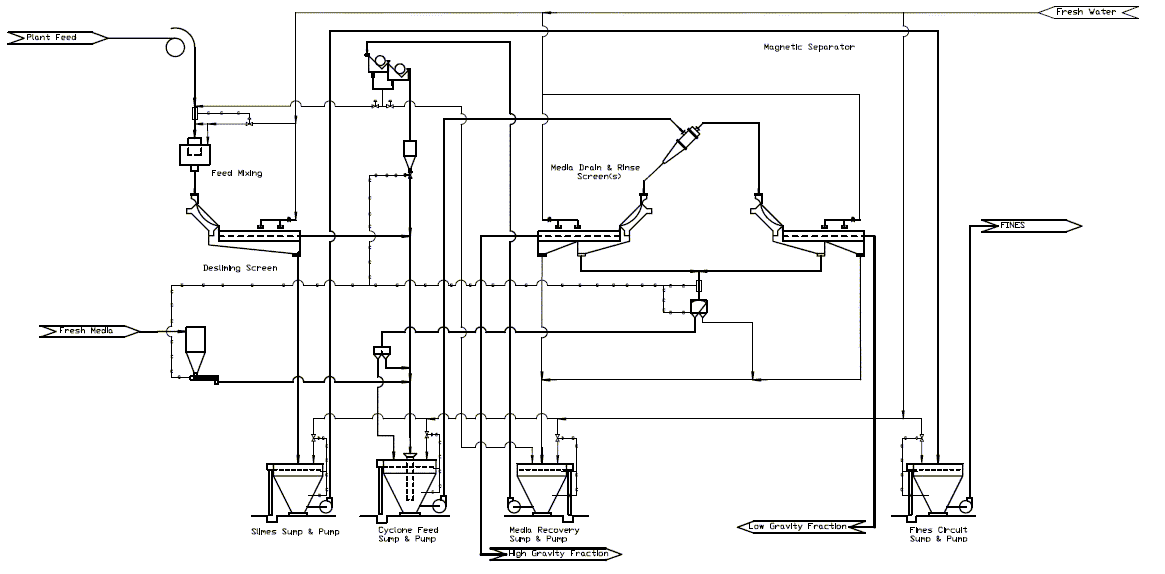
Dilute Medium Recovery Circuit
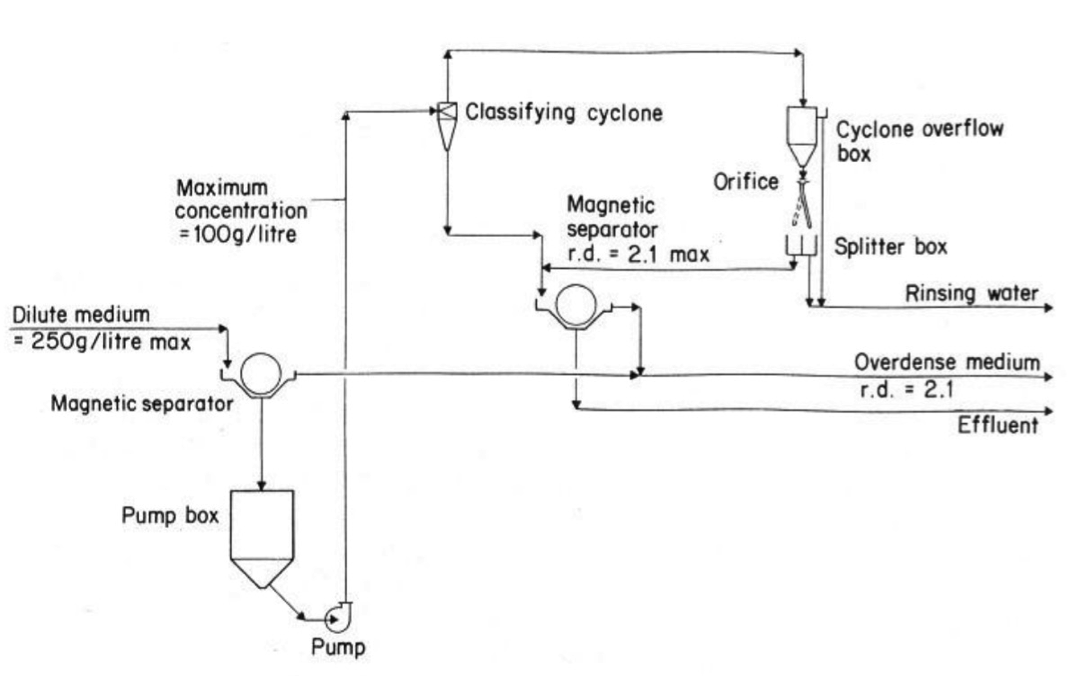
[image 145-3-34]
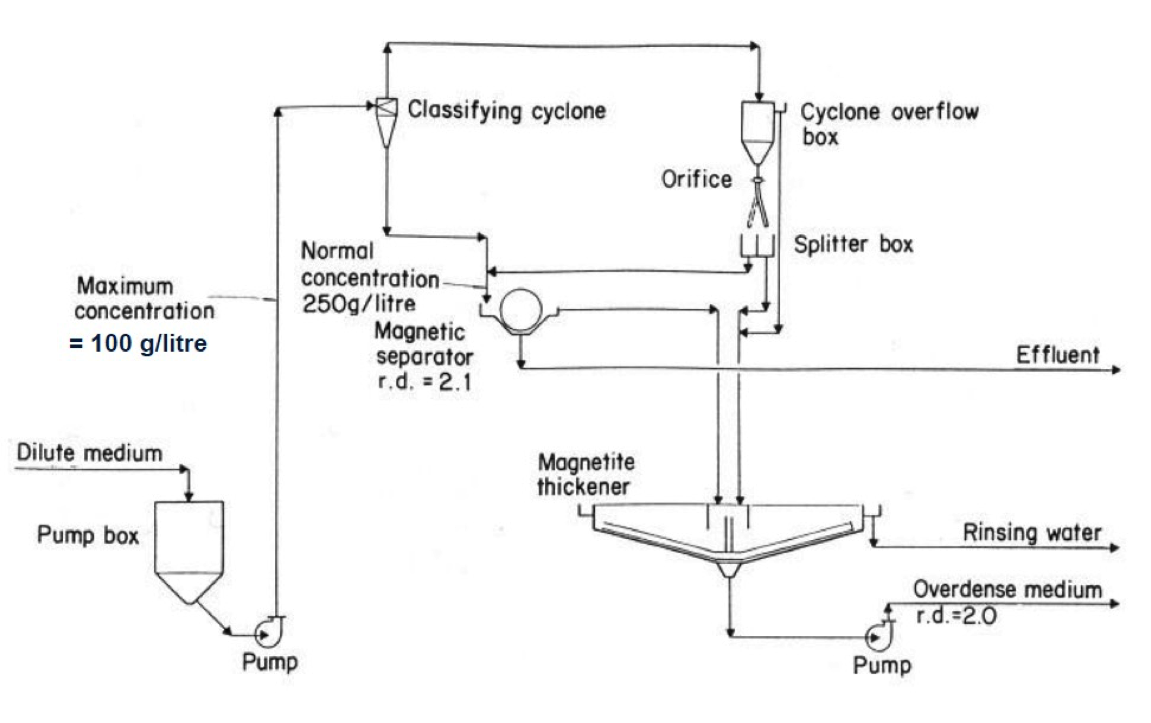
[image 145-3-35]