Contents [show]
Froth flotation is a physico-chemical separation process.
Separation is principally based on differences in surface hydrophobicity.
However, particle size and density have a significant impact.
Initial flotation patent and application was developed for graphite by the Bessel brothers (1877).
Similar to graphite, coal is naturally hydrophobic.
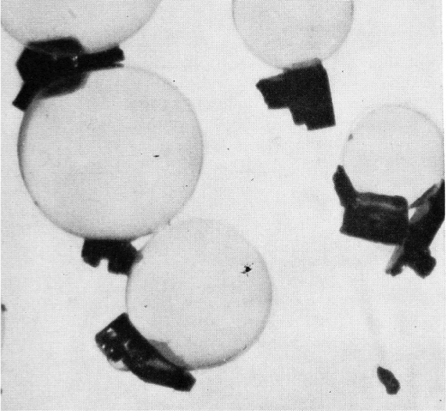
[image 145-5-1]
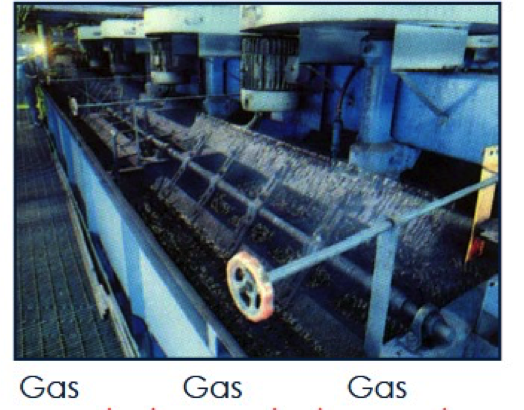
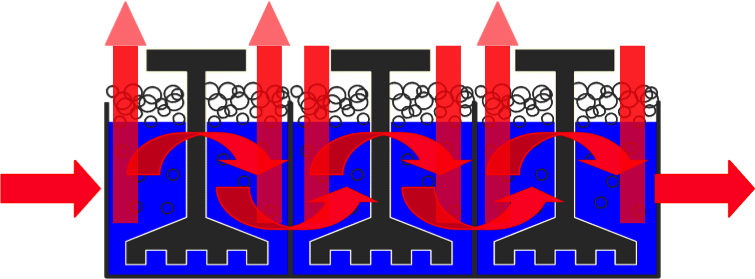
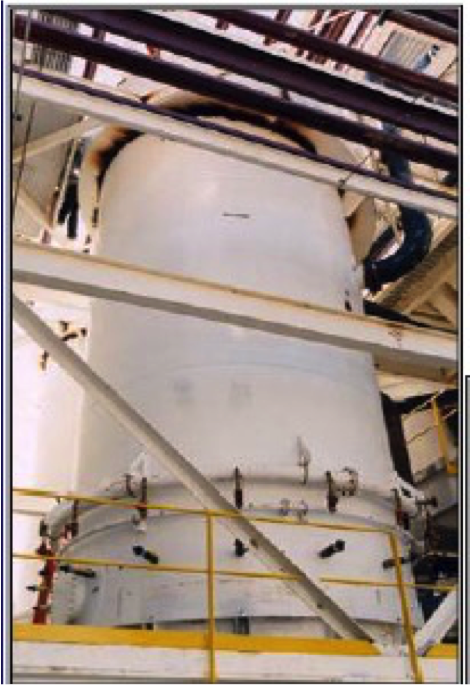
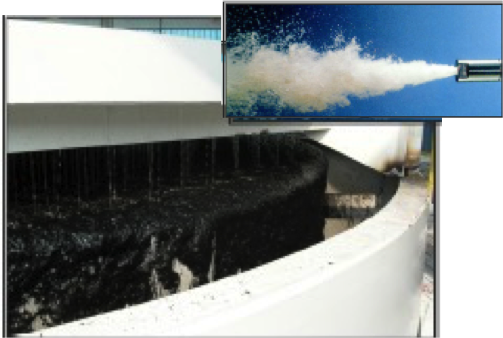
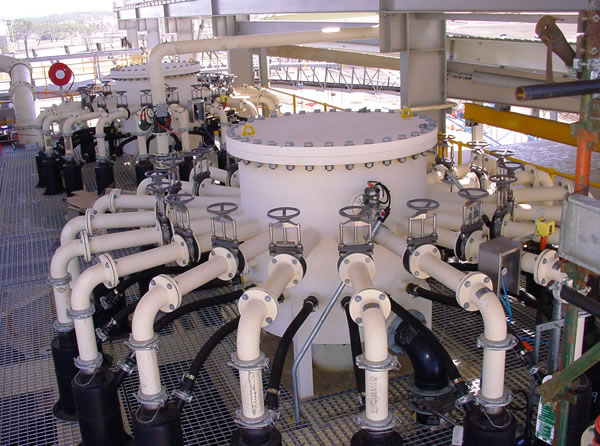
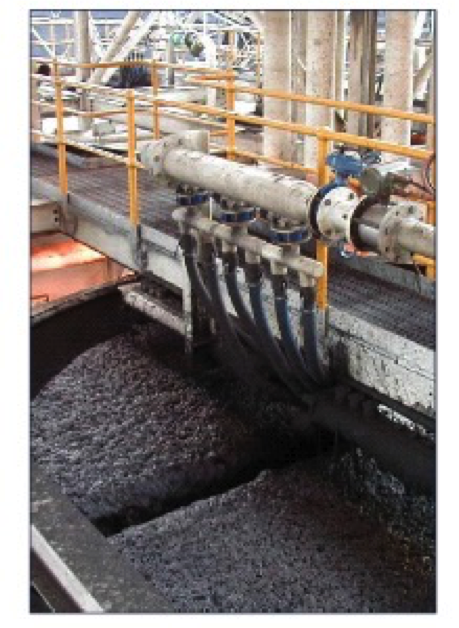
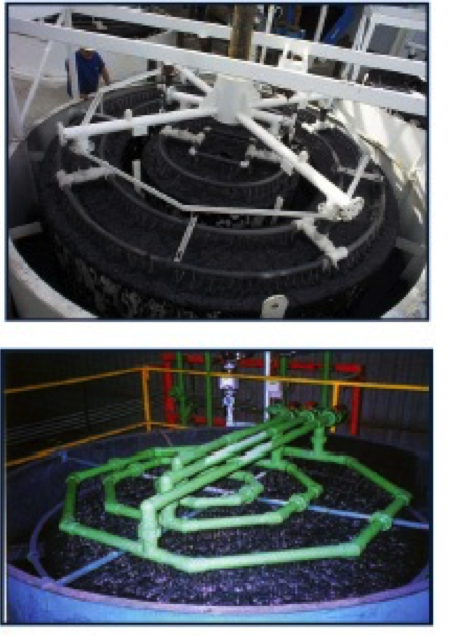
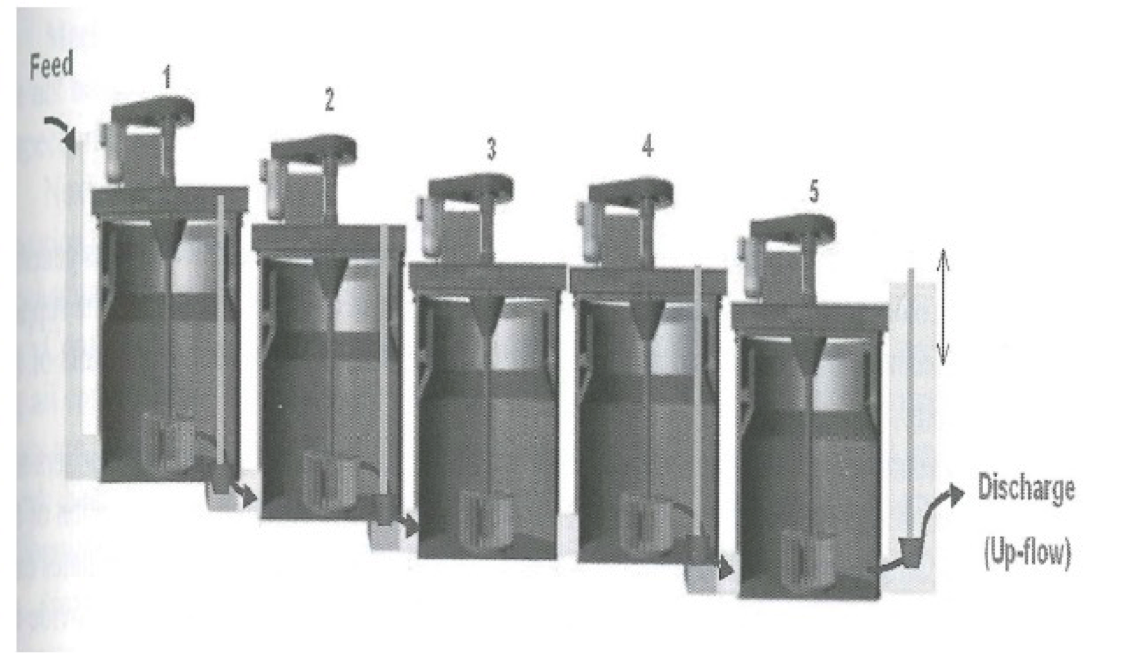
Conventional Flotation
- First developed in 1912.
- Employed throughout the 20th century.
- Low capital cost.
- Due to mixing, several cells are used in series.
- Hydraulic entrainment has always caused a battle between grade and recovery.
- 10 tph/cell capacity
[image 145-5-2]
[image 145-5-3]

[image 145-5-4]
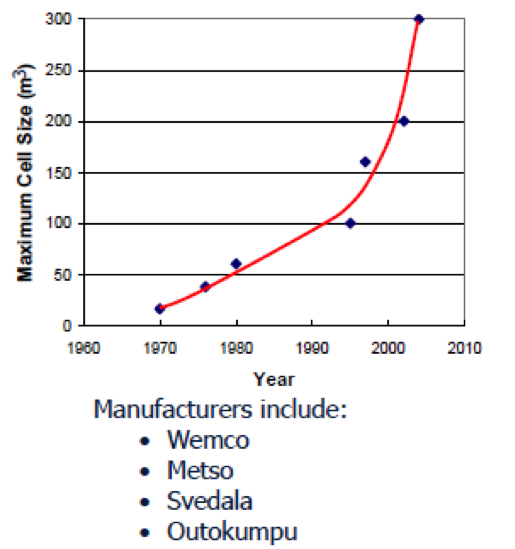
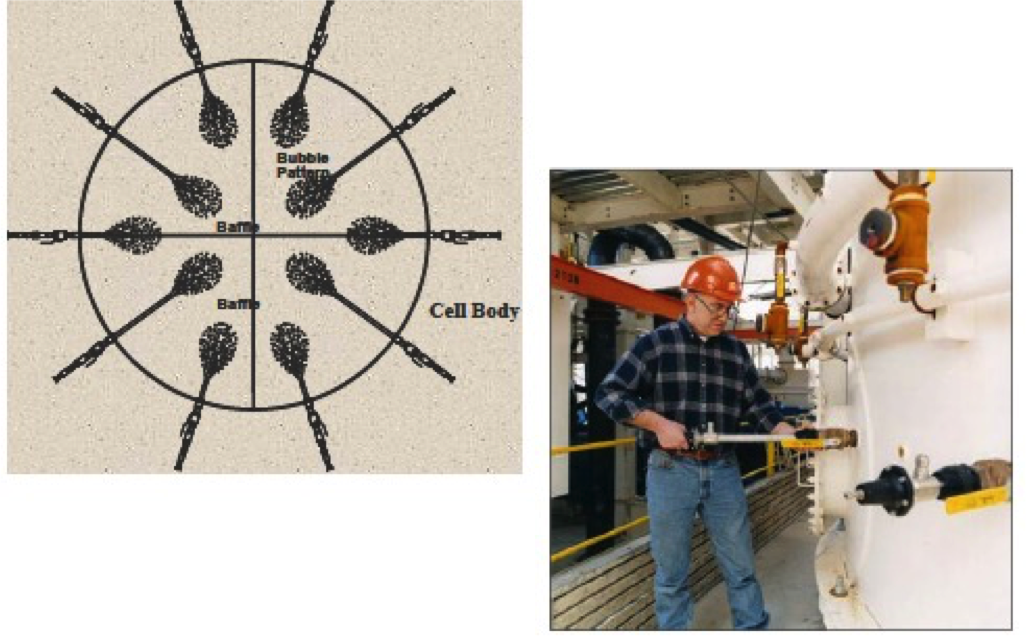
Conventional Cell Development
Current emphasis is the development and optimization of large cells.
Power scale-up and froth recovery are issues.
Also, reduced number of units places an emphasis on ensuring high efficiency from each cell.
A common cell size in the coal industry is 28 m3.
[image 145-5-5]
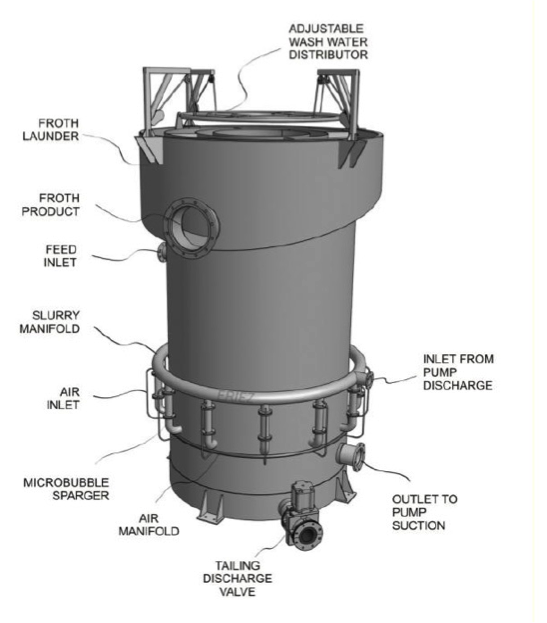
Flotation Columns
- Initial column was invented in 1907.
- Commercial development was minimal until the 1980’s due to sanding of particles in the bottom of the cell.
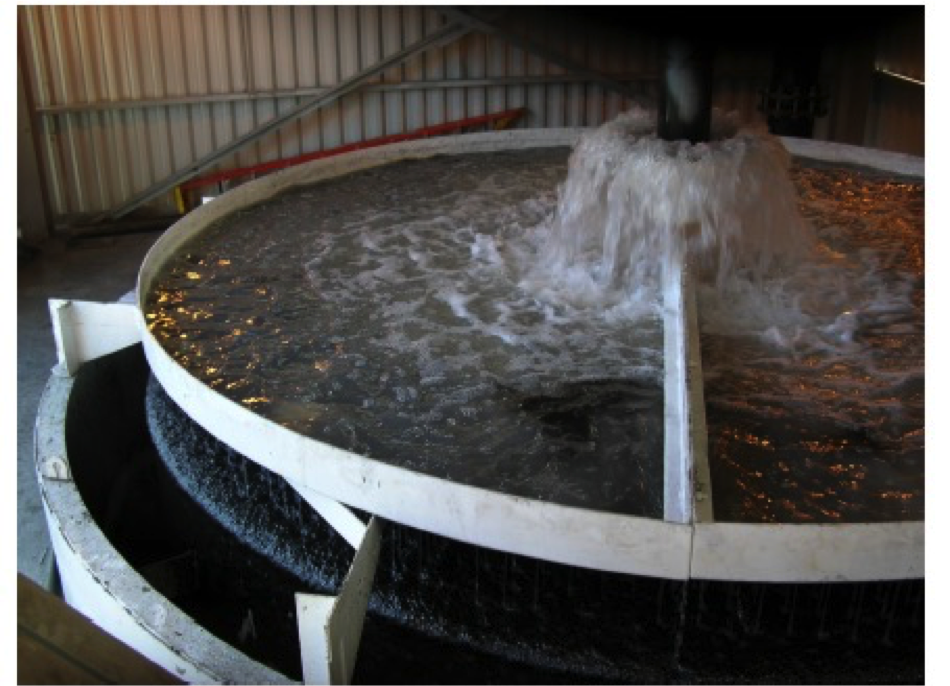
- The ability to use wash water to remove entrainment revived the interest in flotation columns.
- L/D ratio is also significant for ultrafine particles.
- The coal industry is shifting to larger columns, up to 4.5m diameter and greater.
- Types: CoalPro, Microcel, Jameson.

[image 145-5-6]
CoalPro (CPT) Flotation Column
- Developed by Cominco Research and owned by Eriez Manufacturing
- Coarse Bubble Size Distribution
- Good Dispersion w/Sparger Water
- High Aeration Rates
- Low Energy Input
- Typically Use for Deslime Circuit
[image 145-5-7]
[image 145-5-8]
CPT Bubble Generation System

[image 145-5-9]
CPT Flotation Column
[image 145-5-10]
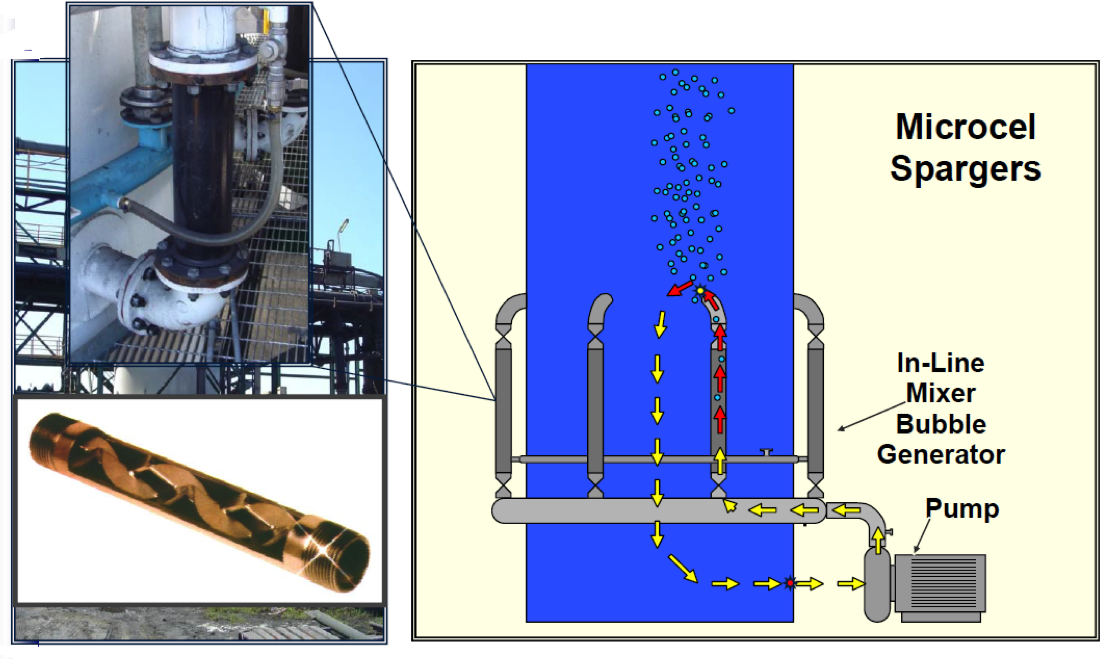
Microcel Column Flotation Technology
- Developed by Virginia Tech in the late 1980’s.
- Licensed by Eriez Manufacturing.
- Reduced Bubble Size
- Tight Bubble Size Distribution
- Increased Capacity
- Additional Pump
- Higher Energy Input
- Typically Use for By- Zero Circuit
[image 145-5-11]
Microcel Bubble Generation
[image 145-5-12]
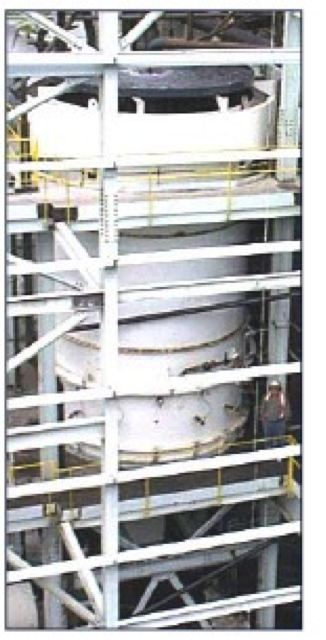
Installation
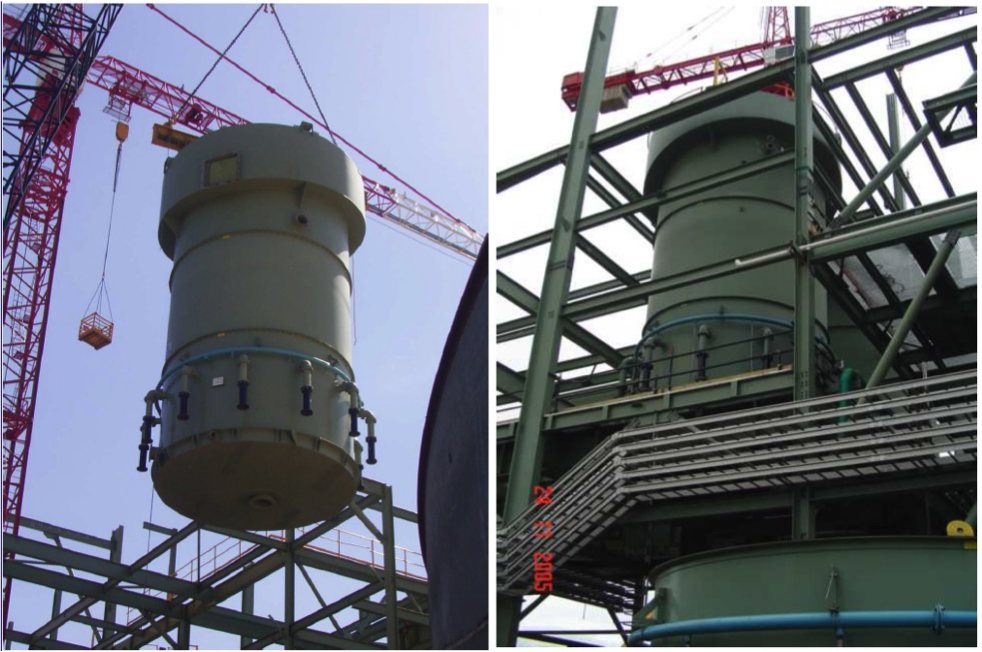
[image 145-5-13]
Column Installation
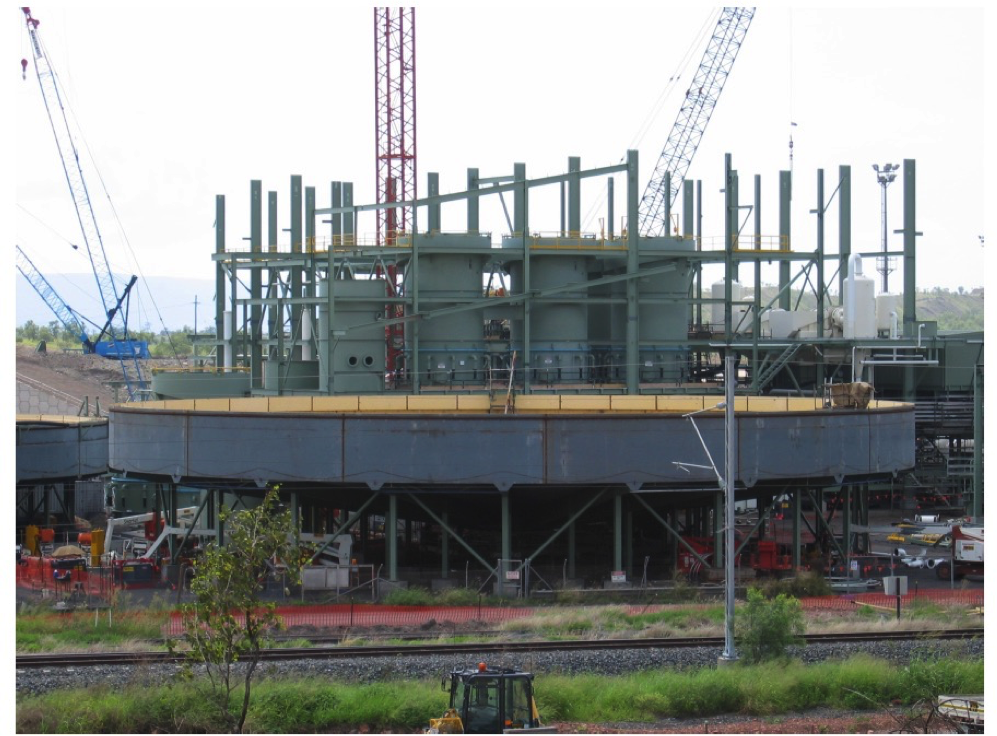
[image 145-5-14]
Jameson Cell
- Developed by Dr. Graeme Jameson and owned by MIM Ltd.
- Self-aspirating system with froth washing.
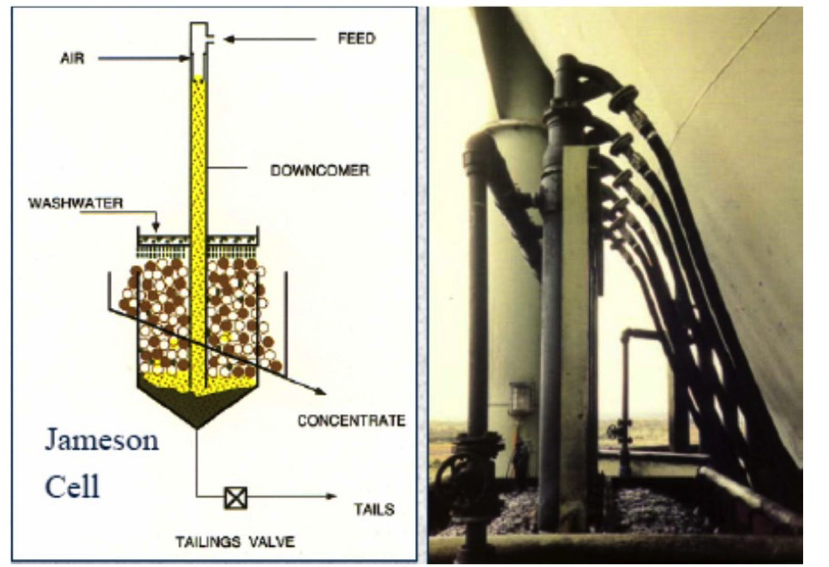
[image 145-5-15a]
[145-5-15b]
Flotation Recovery Fundamentals
A flotation process has two distinctly different phases:
- Collection Zone
- Froth Zone
Both the collation zone (RC) and froth zone (RF) recoveries determine the overall recovery.
Using linear analysis, the overall recovery (R) can be determined:
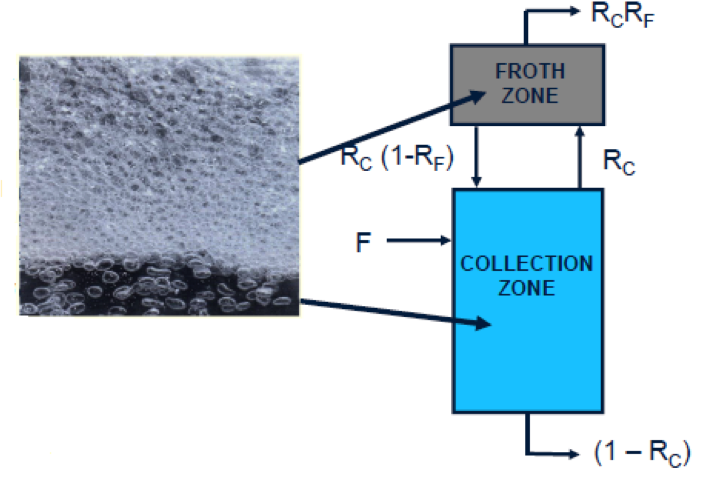
[image 145-5-16]
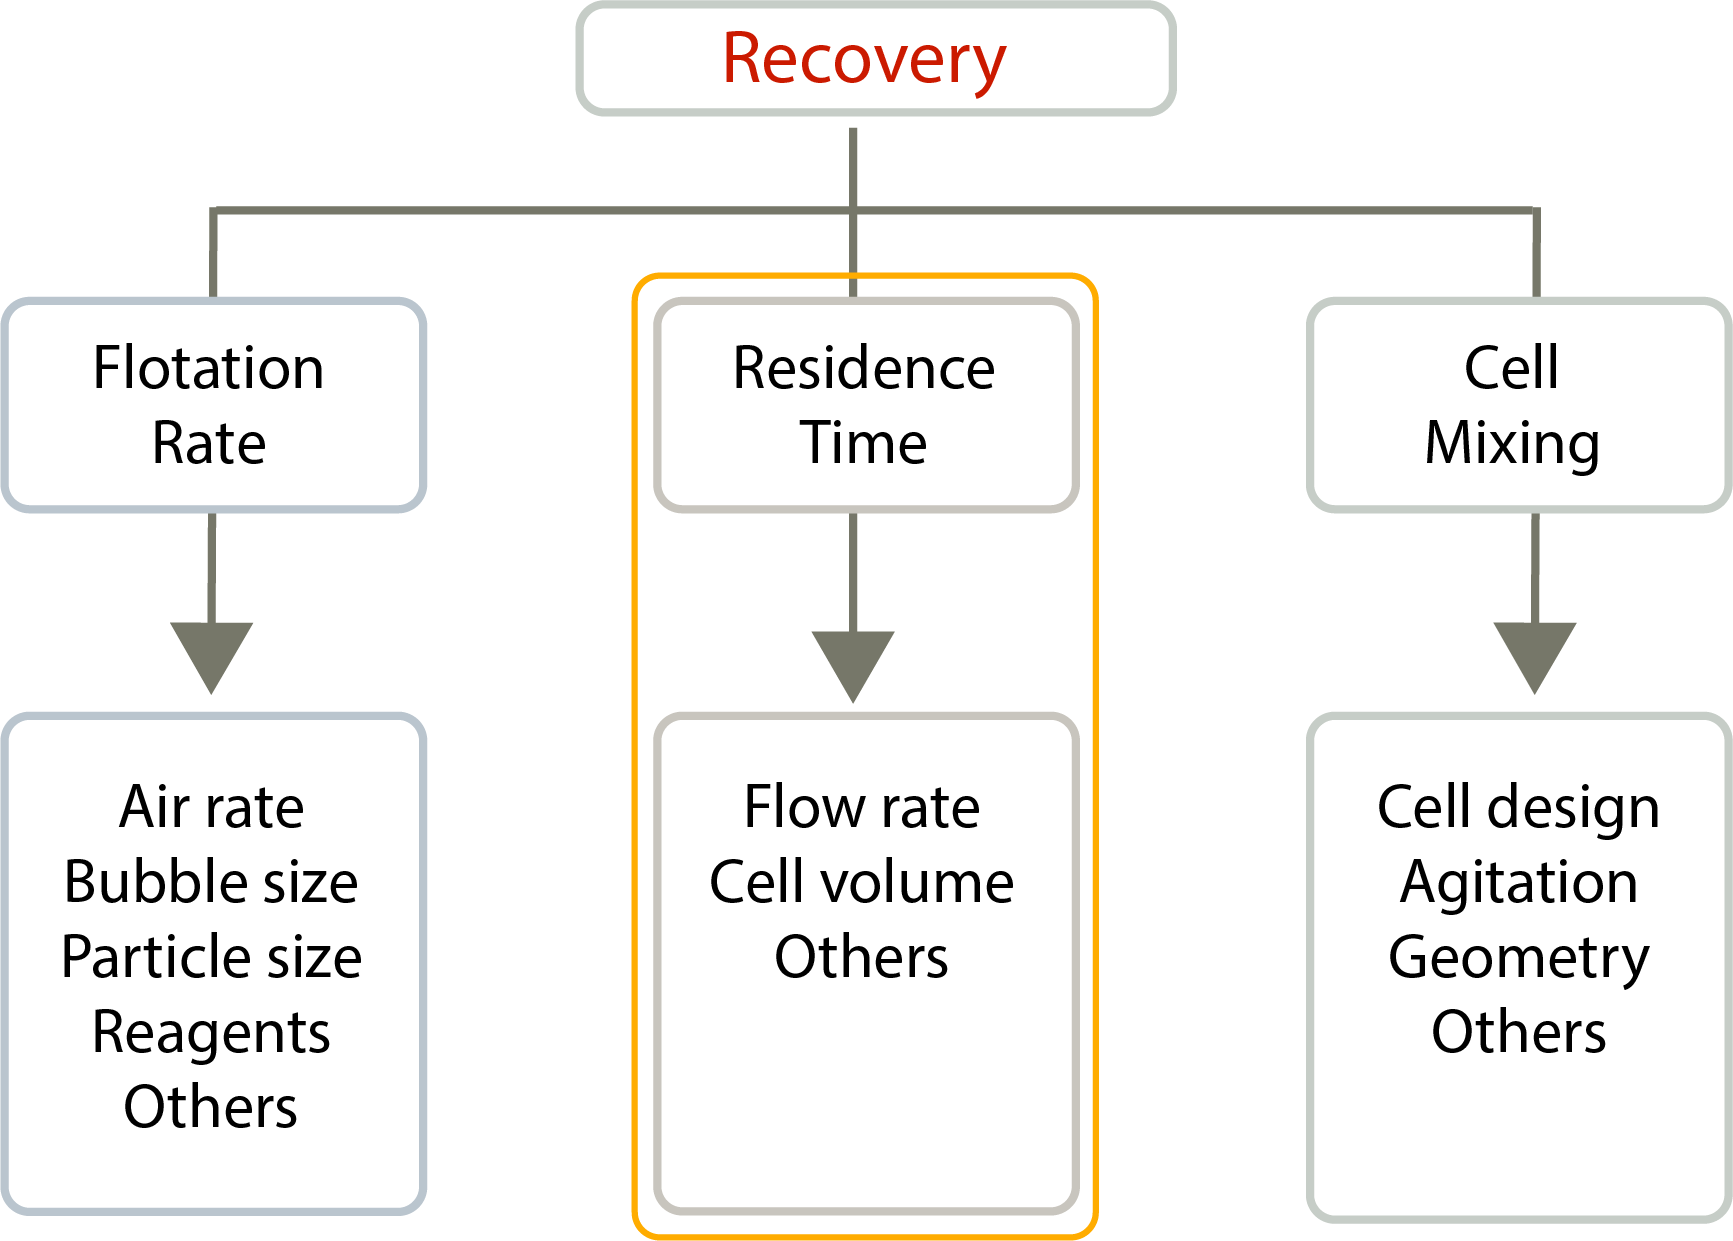
Collection Zone Recovery Parameters
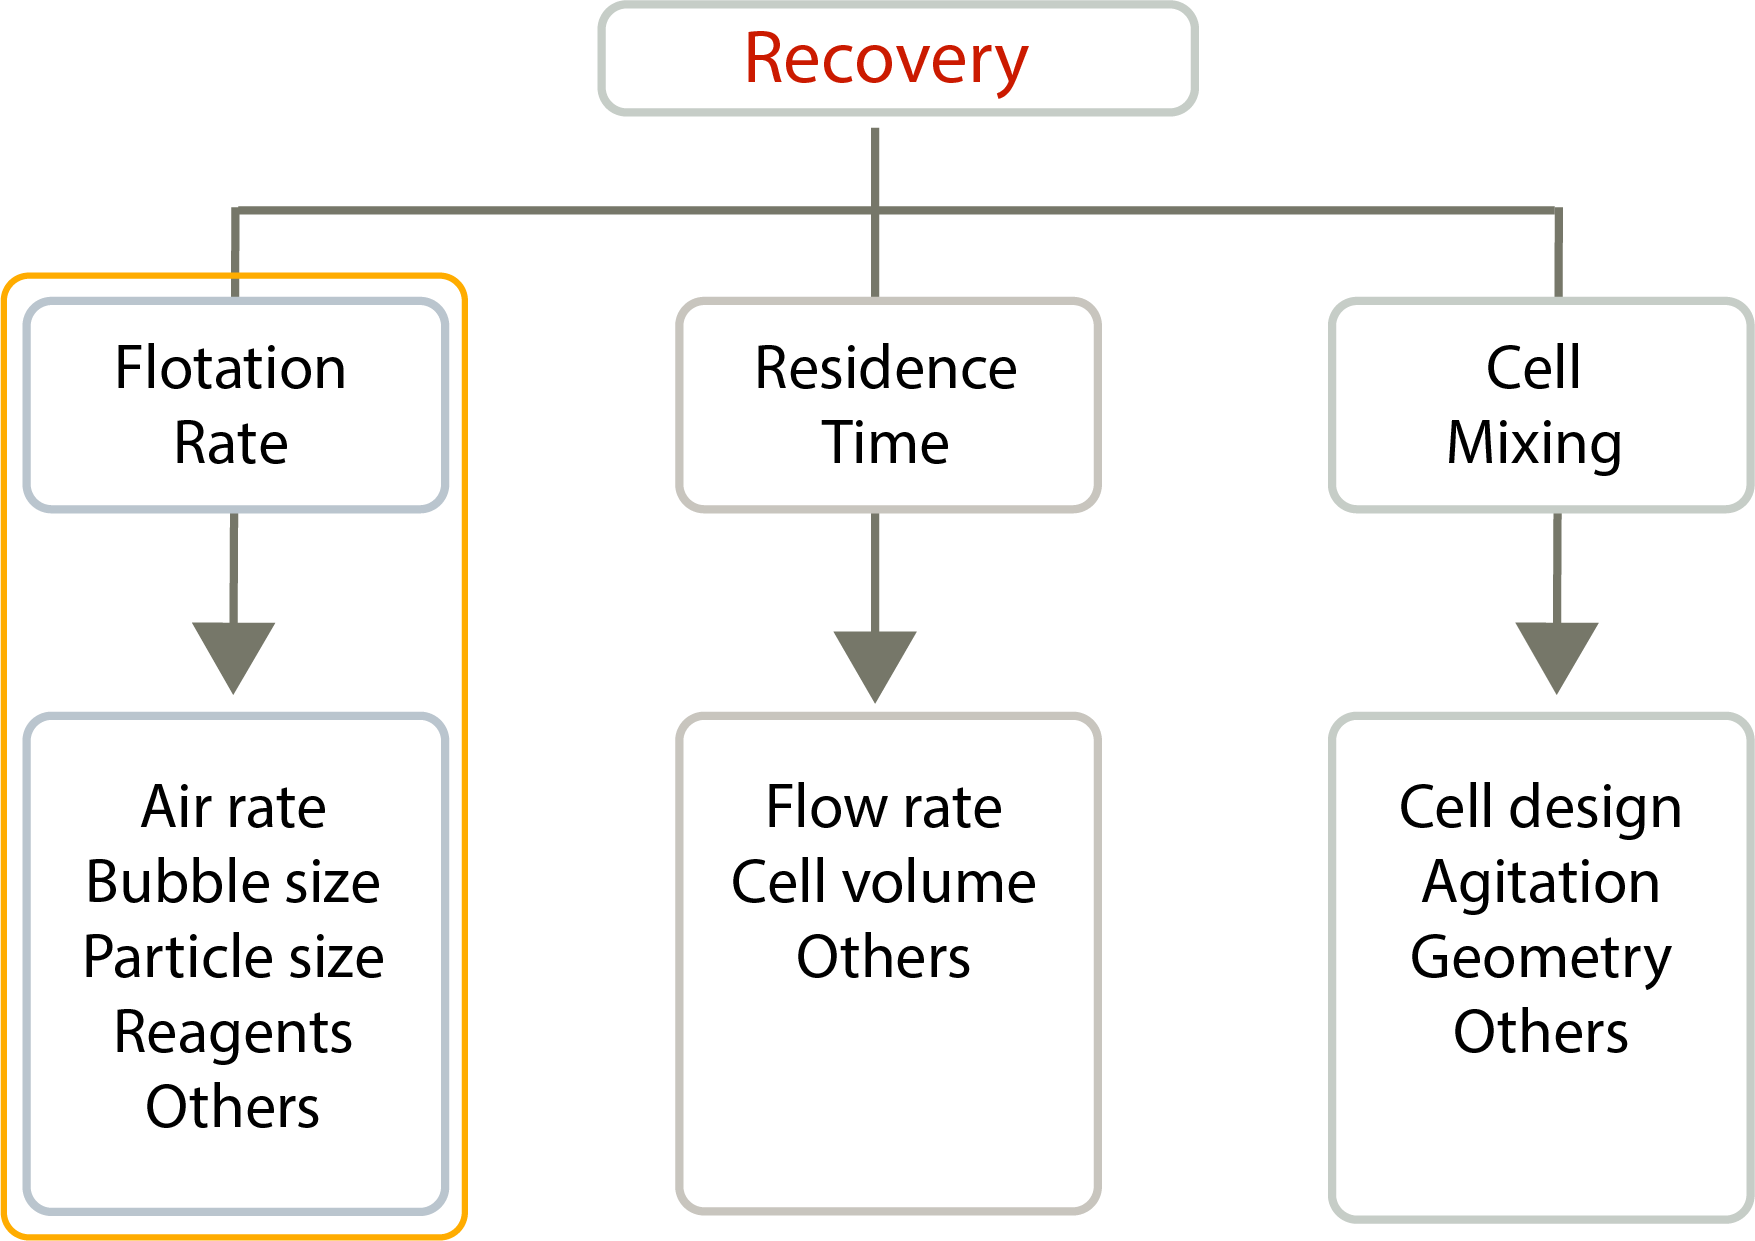
[image 145-5-17]
Collection Zone Recovery, RC
The recovery of a given component in the feed is a function of:
- Flotation Rate, ki
- Particle Residence Time, Tp
- Hydrodynamic Conditions
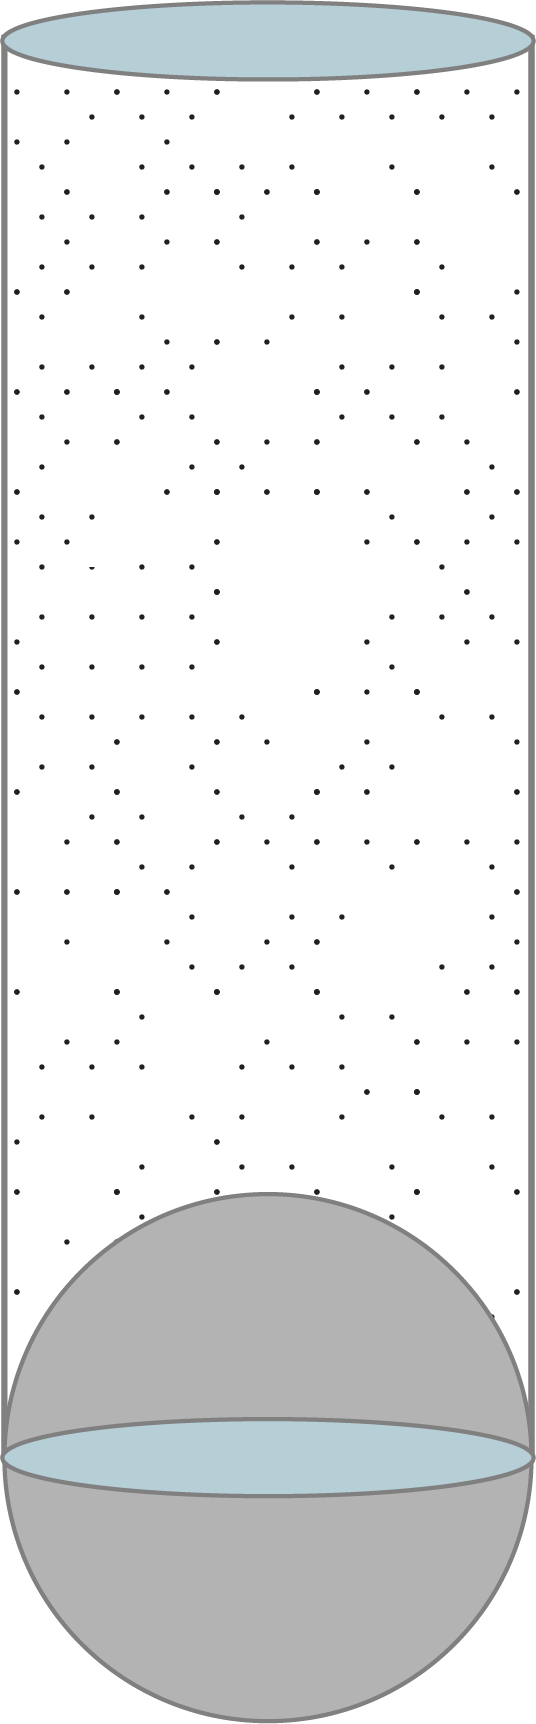
Using Levenspiel’s axial mixing equation, collection zone recovery can be determined by
Mankosa et al. (1992)
Pe → 0, Perfectly mixed conditions →
Pe → ∞, Plug – flow conditions →
Flotation Rate, ki
The flotation rate is a measurement of how fast a particle is recovered in the collection zone.
The flotation rate of a given component can be quantified by:
P = probability of flotation int he collection zone;
Vg = superficial gas velocity;
Db = bubble diameter;
Sb = superficial bubble surface area rate
[image 145-5-18]
Probability of Flotation
- Probability of Collision, PC
- Probability of Attachment, PA
- Probability of Detachment, PD
P = PCPA(1-PD)
For bubble sizes typical in flotation:
Controls the lower particle size limit associated with the flotation of a given particle type.

[image 145-5-19]
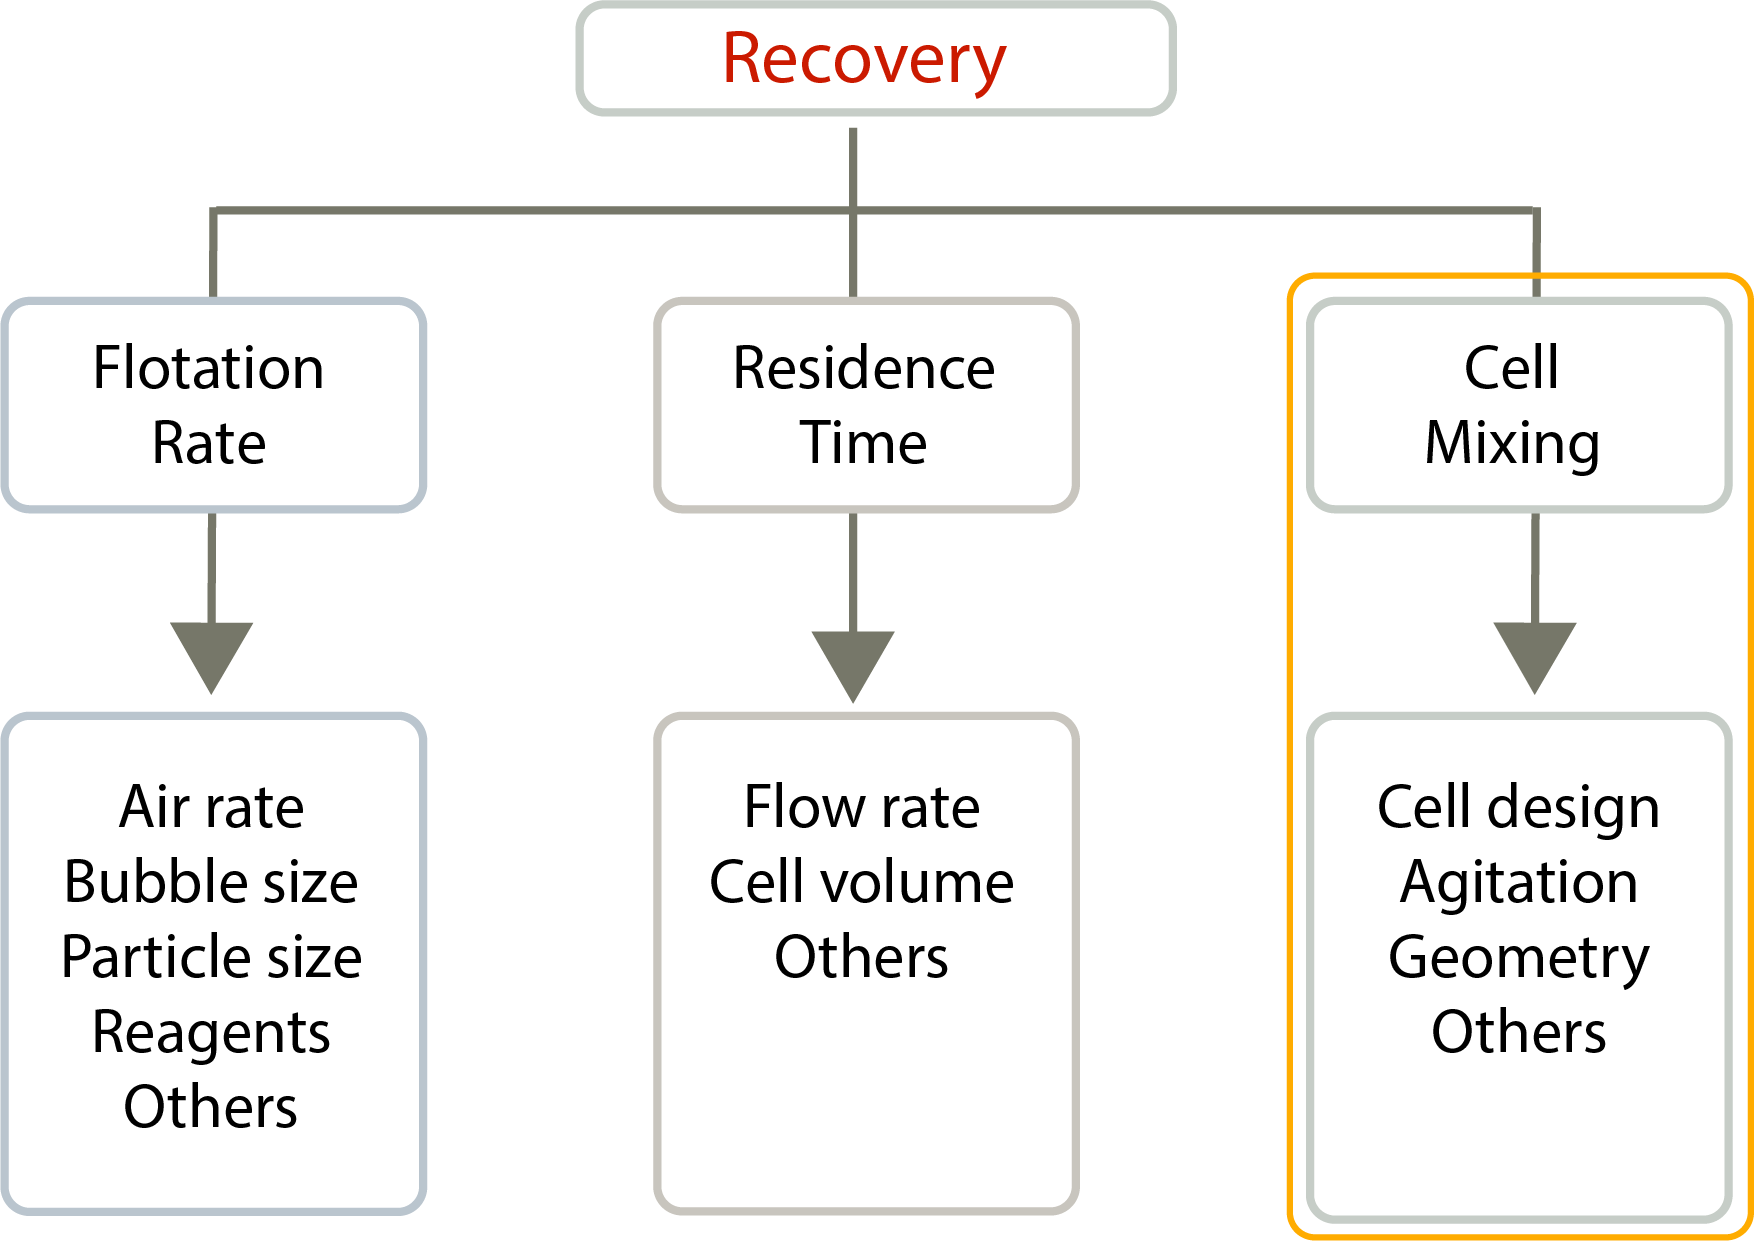
Collection Zone Recovery Parameters
[image 145-5-20]
Flotation Rate Differential Effect
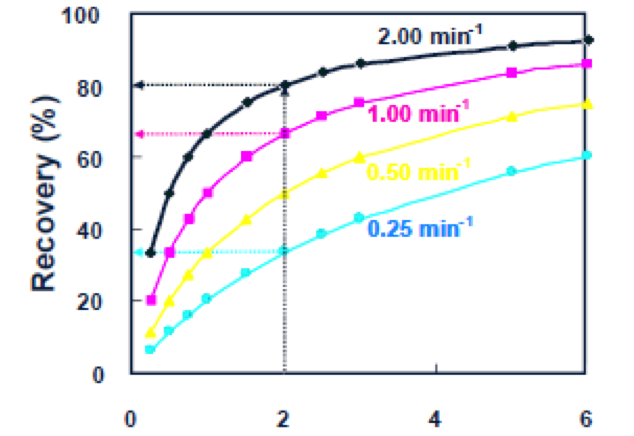
[image 145-5-21a]
= mass floated per unit of time
k = flotation rate (min-1)
t = flotation time (min)
M = mass flotation cell
| Species | No Collector | Collector | ||
|---|---|---|---|---|
| 1 | k = 1.0 | R = 68% | K = 2.0 | R = 80% |
| 2 | k = 0.25 | R = 33% | k = 1.0 | R = 68% |
Typical Flotation Residence Times
| Material | Typical solids concentration for roughing applications, percent | Typical residence times for roughing applications, minutes | Typical laboratory flotation times, minutes |
|---|---|---|---|
| Copper | 32-42 | 13-16 | 6-8 |
| Lead | 25-35 | 6-8 | 3-5 |
| Molybdenum | 35-45 | 14-20 | 6-7 |
| Nickel | 28-32 | 10-14 | 6-7 |
| Tungsten | 25-32 | 8-12 | 5-6 |
| Zinc | 25-32 | 8-12 | 5-6 |
| Barite | 30-40 | 8-10 | 4-5 |
| Coal | 4-8 | 3-5 | 2-3 |
| Feldspar | 25-35 | 8-10 | 3-4 |
| Flourspar | 25-35 | 8-10 | 4-5 |
| Phosphate | 30-35 | 4-6 | 2-3 |
| Potash | 25-35 | 4-6 | 2-3 |
| Sand (Impurity Float) | 30-40 | 7-9 | 3-4 |
| Silica (Iron Ore) | 40-50 | 8-10 | 3-5 |
| Silica (Phosphate) | 30-35 | 4-6 | 2-3 |
| Effluents | As received | 7-12 | 4-5 |
| Oil | As received | 4-6 | 2-3 |
[image 145-5-22]
Froth Recovery, RF
Recovery through the froth phase can be achieved as a result of one of the following:
- Bubble-Particle Attachment
- Particle Entrapment
- Hydraulic Entrainment
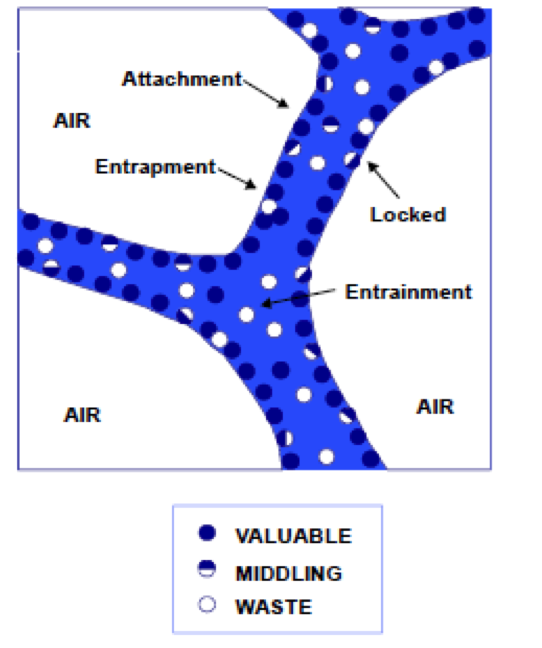
[image 145-5-23]
Flotation Carrying Capacity
| Feed Size (Micron) | Target Capacity (tph/m2) |
| Minus 600
Minus 150 Minus 45 150 x 45 |
1.8-2.6
1.0-1.4 0.6-0.9 1.8-2.2 |
Example:
3m diameter column
CC = 1.2 tph/m2
Froth = 1.2 x Area
= 1.2 x 7.065 m2
= 8,5 tph
[145-5-24a]
Froth Washing Fundamentals
Selectivity in a flotation process is typically achieved on the basis of differences in surface hydrophobicity.
However, selectivity is based on all recovery mechanisms as well as hydrodynamic conditions.
Selectivity can be enhanced by:
- Maximizing flotation rate differences.
- Eliminating or Minimizing Entrainment.
- Selective Detachment.
- High length-to-diameter ratios.
[image 145-5-25]
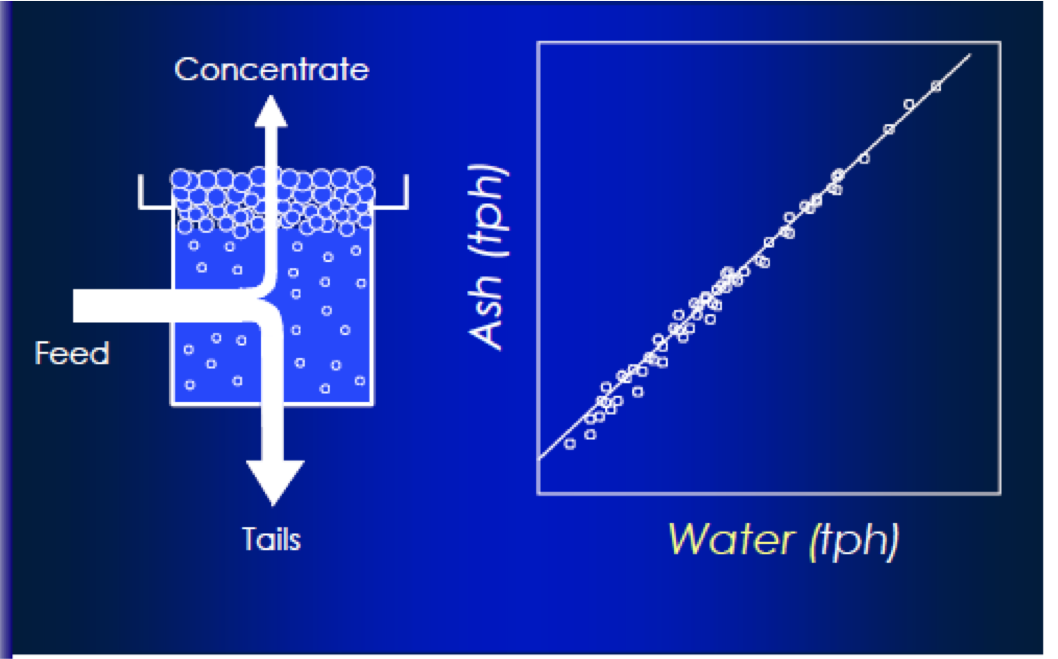
Hydraulic Entrainment
[image 145-5-26]
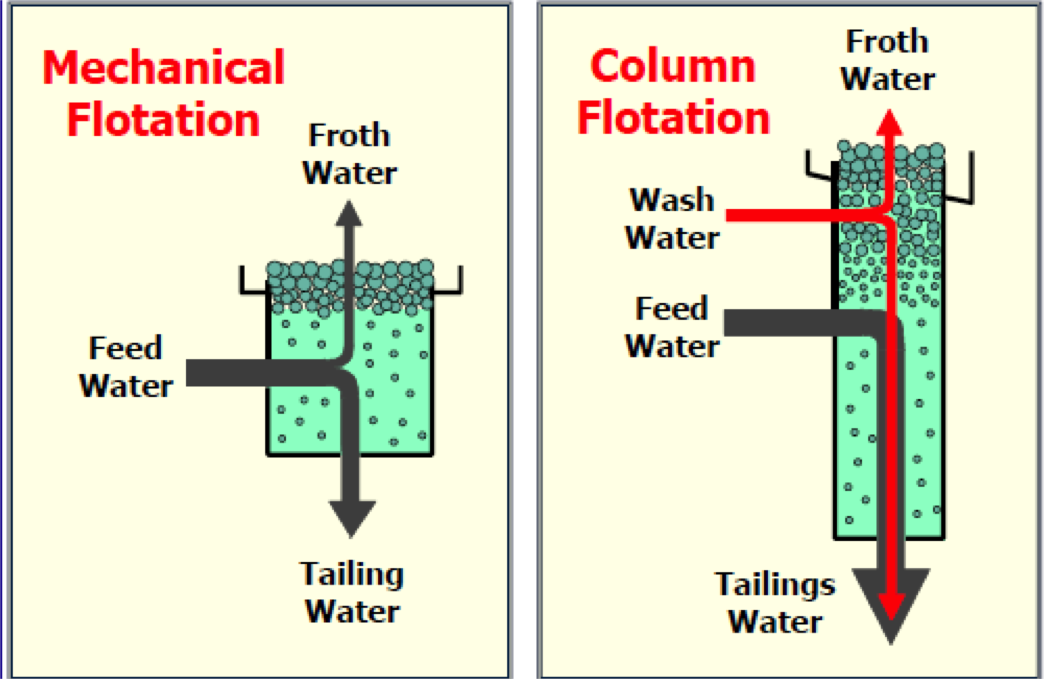
Froth Washing; The Original Flotation Column Benefit
[image 145-5-27]
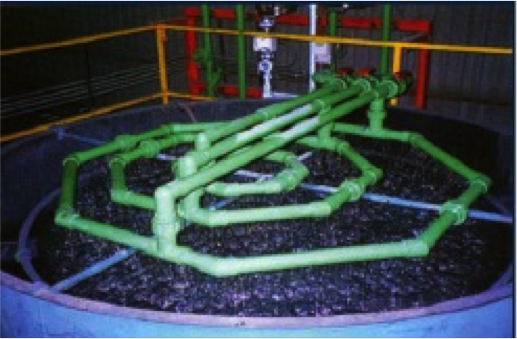
Pan-Type Froth Wash Water System
[image 145-5-28]
Wash Water Ring System

[image 145-5-29]
[image 145-5-30]
Entrainment Effect on Separation Performance
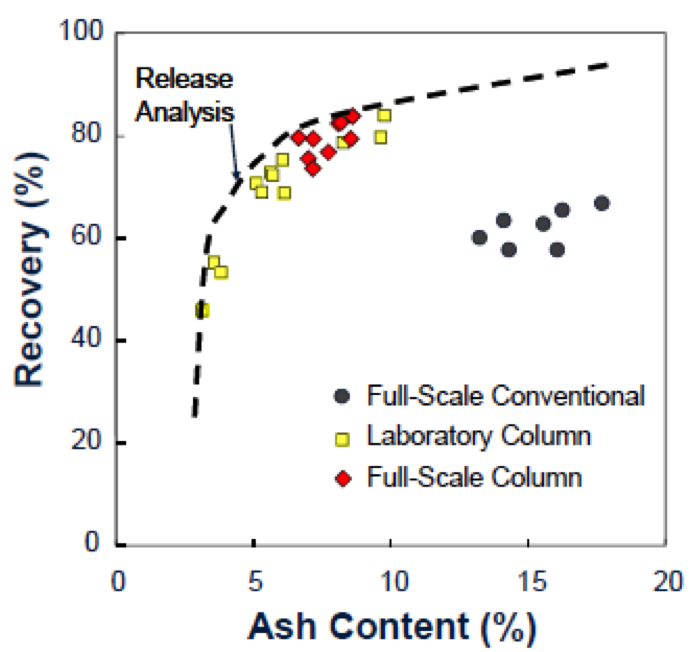
[image 145-5-31]
[image 145-5-32]
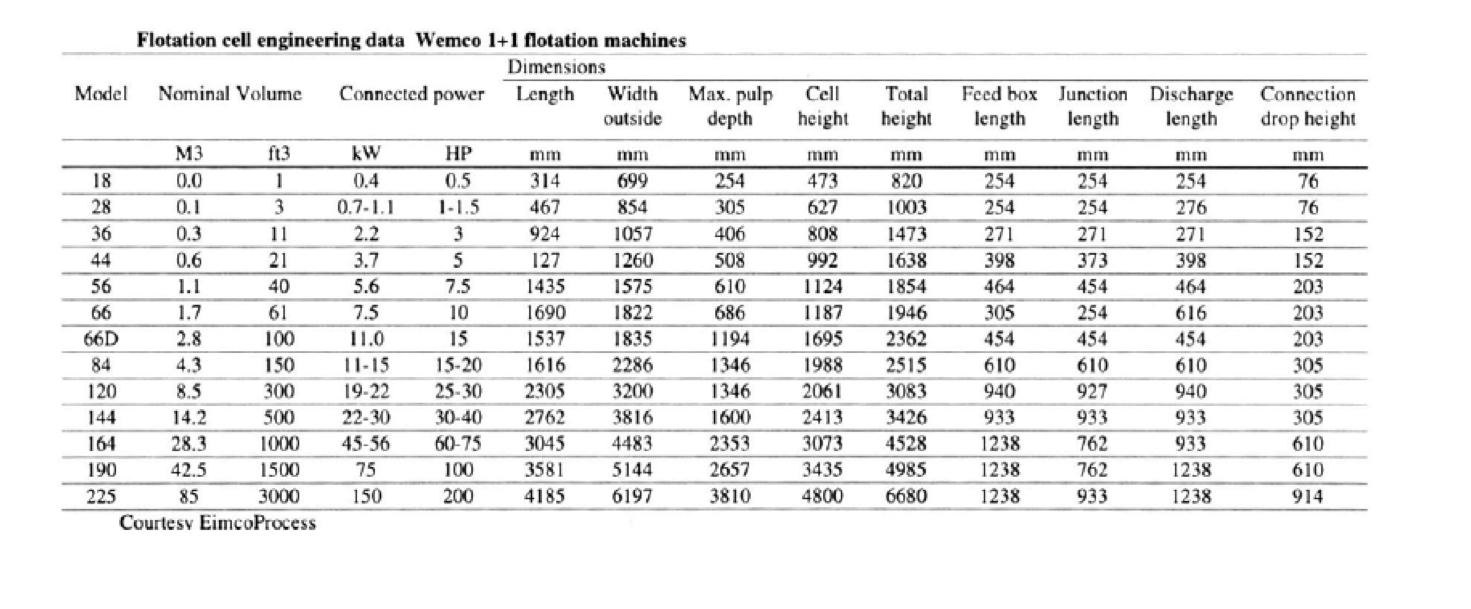
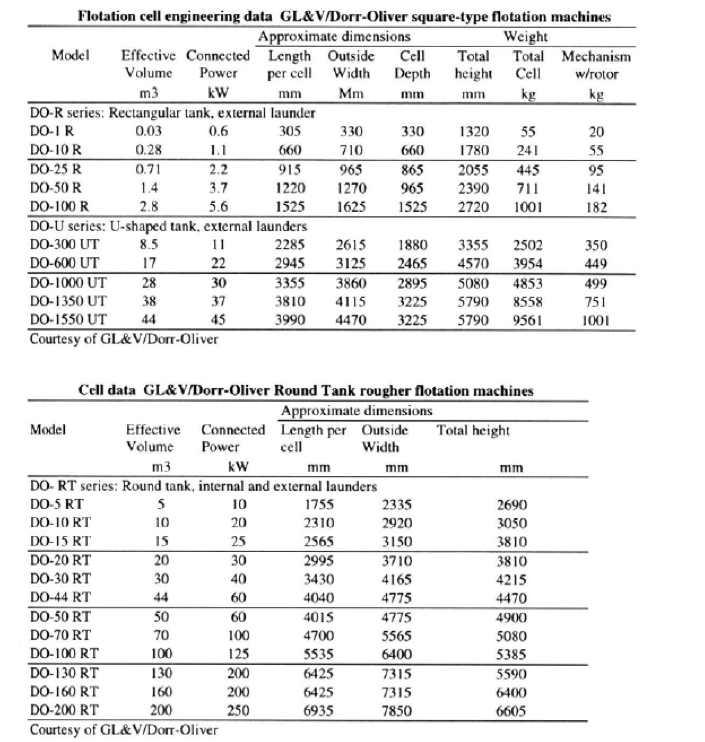
Typical Flotation Cell Dimensions
| Trade Name | Length (m) | Width (m) | Depth (m) | Pulp Volume (m3) |
|---|---|---|---|---|
| Denver 100 | 1.52 | 1.52 | 1.22 | 2.8 |
| Denver 200 | 1.83 | 1.83 | 1.59 | 5.7 |
| Denver 300 | 2.10 | 2.10 | 1.89 | 8.5 |
| Denver 400 | 2.30 | 2.30 | 2.12 | 11.3 |
| Denver500 | 2.70 | 2.70 | 1.98 | 14.2 |
| Wemco 44 | 1.12 | 1.12 | 0.51 | 0.57 |
| Wemco 66 | 1.52 | 1.68 | 0.69 | 1.7 |
| Wemco 84 | 1.60 | 2.13 | 1.35 | 4.2 |
| Wemco 120 | 2.29 | 3.05 | 1.35 | 8.5 |
| Wemco 144 | 2.74 | 3.66 | 1.60 | 14.2 |
| Wemco 164 | 3.02 | 4.17 | 2.36 | 28.3 |
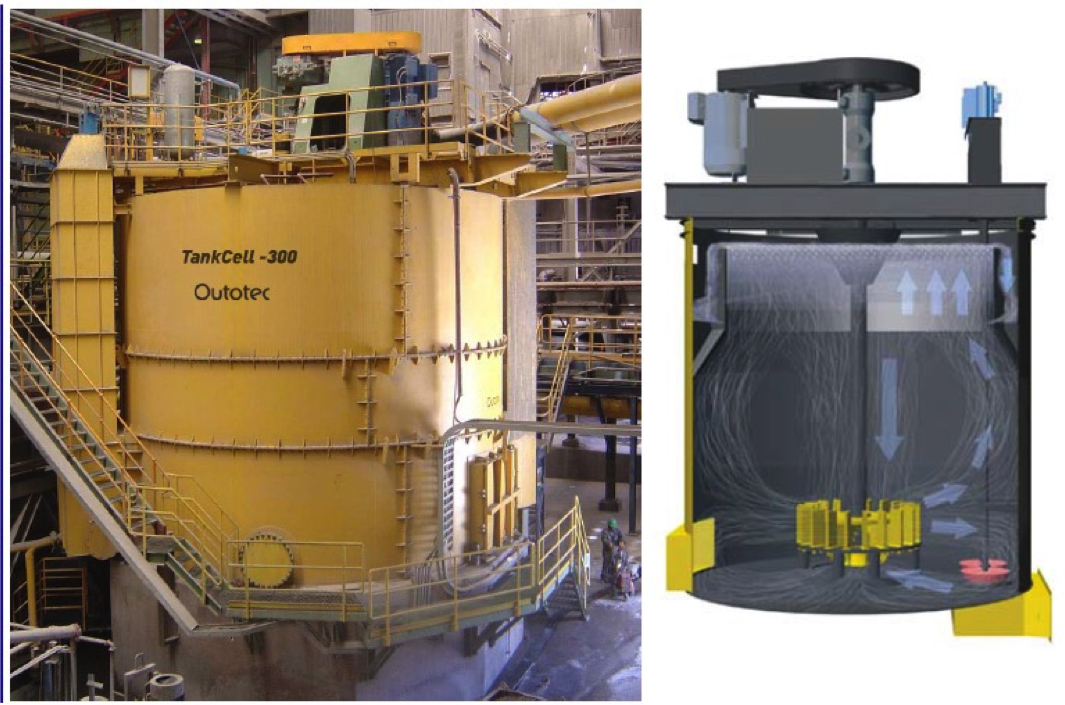
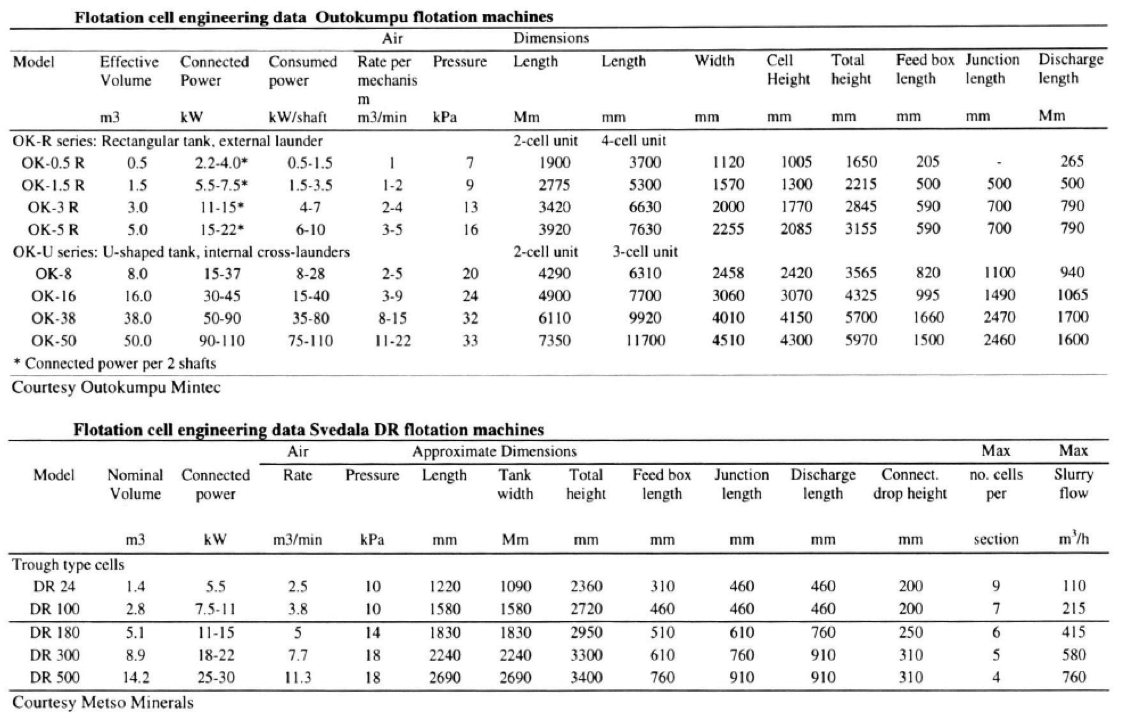
Wemco Convention & Outotec Tank Cells
[image 145-5-33]
Outotec Tank Cells
| Model | Cell Volume (m3) | Diameter (m) | Lip Length (m) | Froth Area (2) | Air Flow (m3) | Motor (kW) |
|---|---|---|---|---|---|---|
| TankCell-5 | 5 | 2.0 | 4.7 | 3.0 | 2.8 | 11 |
| TankCell-10 | 10 | 2.5 | 6.3 | 4.7 | 4.3 | 18.5 |
| TankCell-20 | 20 | 3.1 | 7.9 | 7.1 | 6.7 | 37 |
| TankCell-30 | 30 | 3.6 | 9.4 | 9.7 | 9.0 | 45 |
| TankCell-40 | 40 | 3.8 | 10.0 | 10.6 | 10.0 | 55 |
| TankCell-50 | 50 | 4.7 | 12.7 | 16.5 | 15.0 | 110 |
| TankCell-70 | 70 | 5.3 | 14.1 | 21.3 | 19.0 | 110 |
| TankCell-100 | 100 | 3.0 | 16.3 | 27.5 | 25.0 | 132 |
| TankCell-130 | 130 | 6.4 | 17.6 | 31.0 | 28.0 | 160 |
| TankCell-160 | 160 | 6.8 | 19.0 | 35.2 | 32.0 | 185 |
| TankCell-200 | 200 | 7.2 | 20.1 | 40.0 | 36.0 | 250 |
| TankCell-300 | 300 | 8.0 | 22.0 | 49.0 | 45.0 | 300 |
[image 145-5-34]
[image 145-5-36]
[image 145-5-33]
[image 145-5-37]
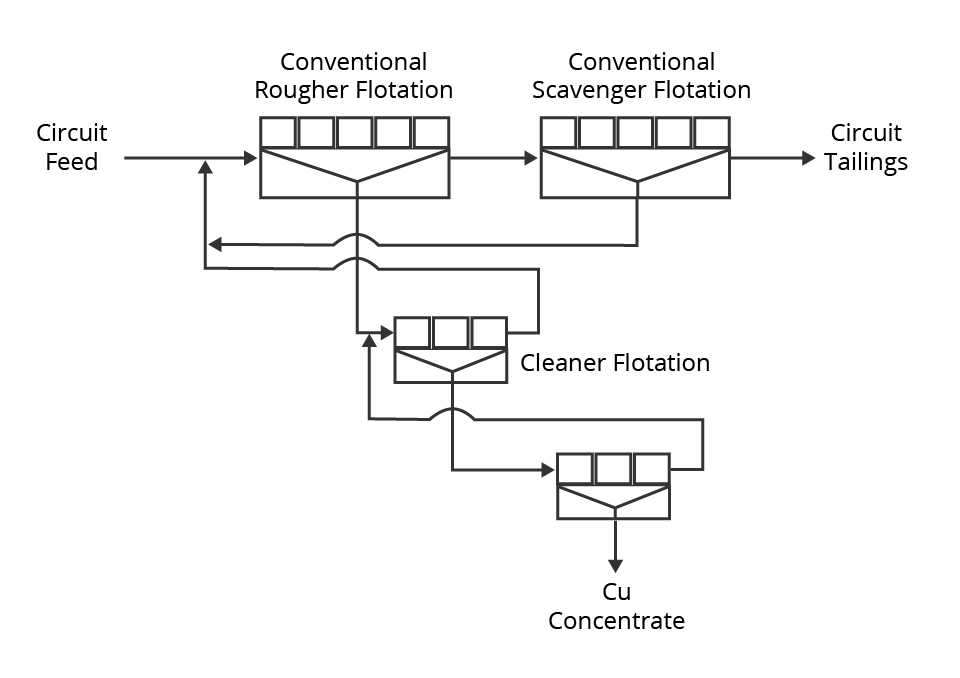
Flotation Circuits
Flotation circuits are typically comprised of rougher, scavenger and cleaner flotation banks.
Rougher and scavenger banks are focused on recovery and thus provide maximum residence time.
Rougher banks can be large with the number of cells being 5 or greater.
Scavenger cells are the last line of defense for avoiding losses. Therefore, they are generally larger in size and numbers.
Cleaner banks are focused on product grade and thus provide low residence time. As such, the number of cells are lower and the cells smaller.
Column flotation is sometimes used as cleaners.
[145-5-38]
Rougher-Scavenger-Cleaner Effect

[image 145-5-39]
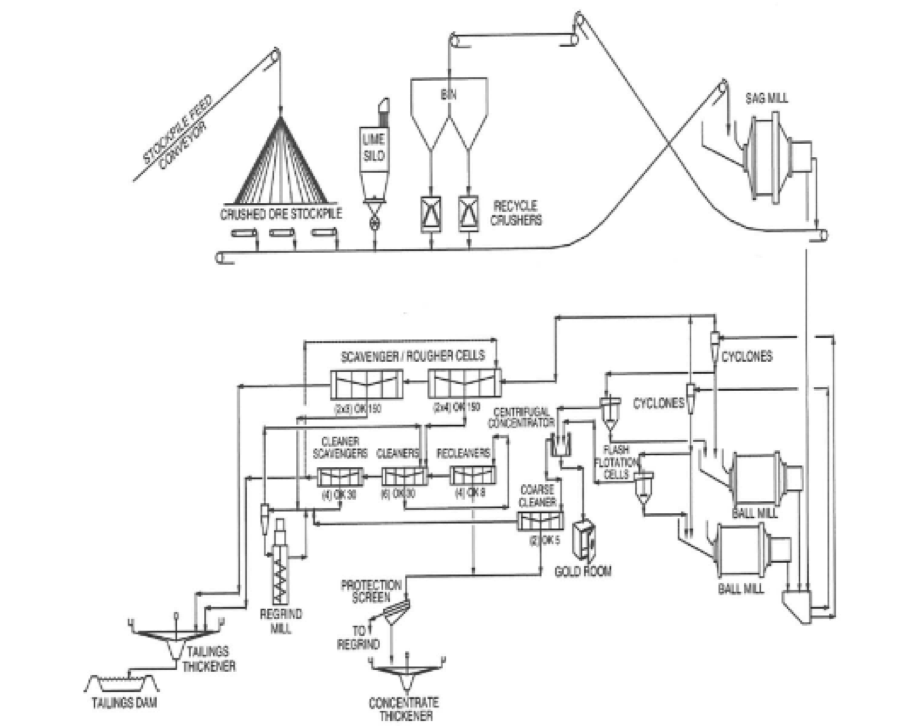
Cadia Processing Facility
[image 145-5-40]
Cadia Metallurgical Balance Sheet
| Stream | Cu | Au |
|---|---|---|
| Head Grade (%, g/t) | 0.19 | 0.77 |
| Concentrate Grade (%, g/t) | 26.3 | 81.0 |
| Overall Recovery (%) | 77.9 | 71.2 |
| Dorè Recovery (%) | --- | 11.3 |
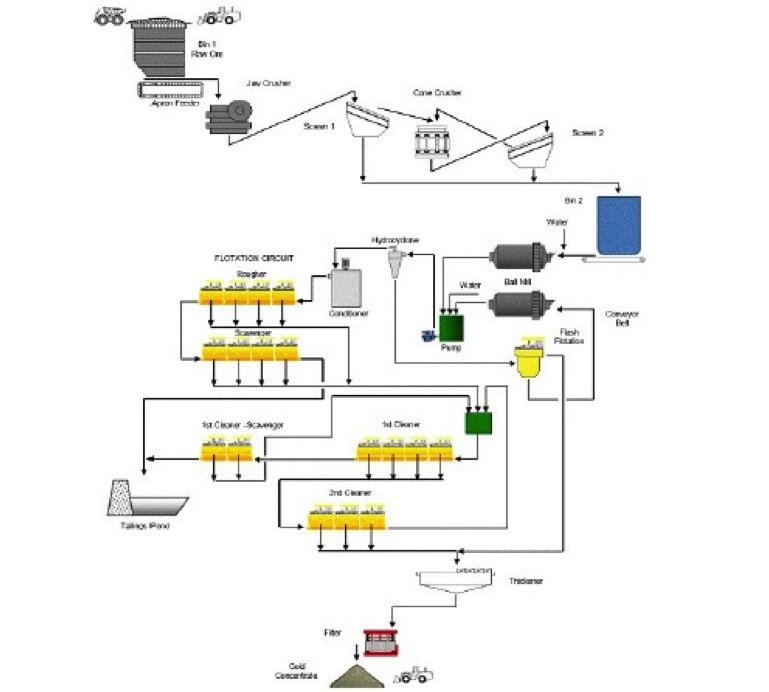
Gold Flotation Circuit
[image 145-5-41]